Nicolas Antille
Making engineering, science and art converge with data-driven analysis, reconstruction and visualization.
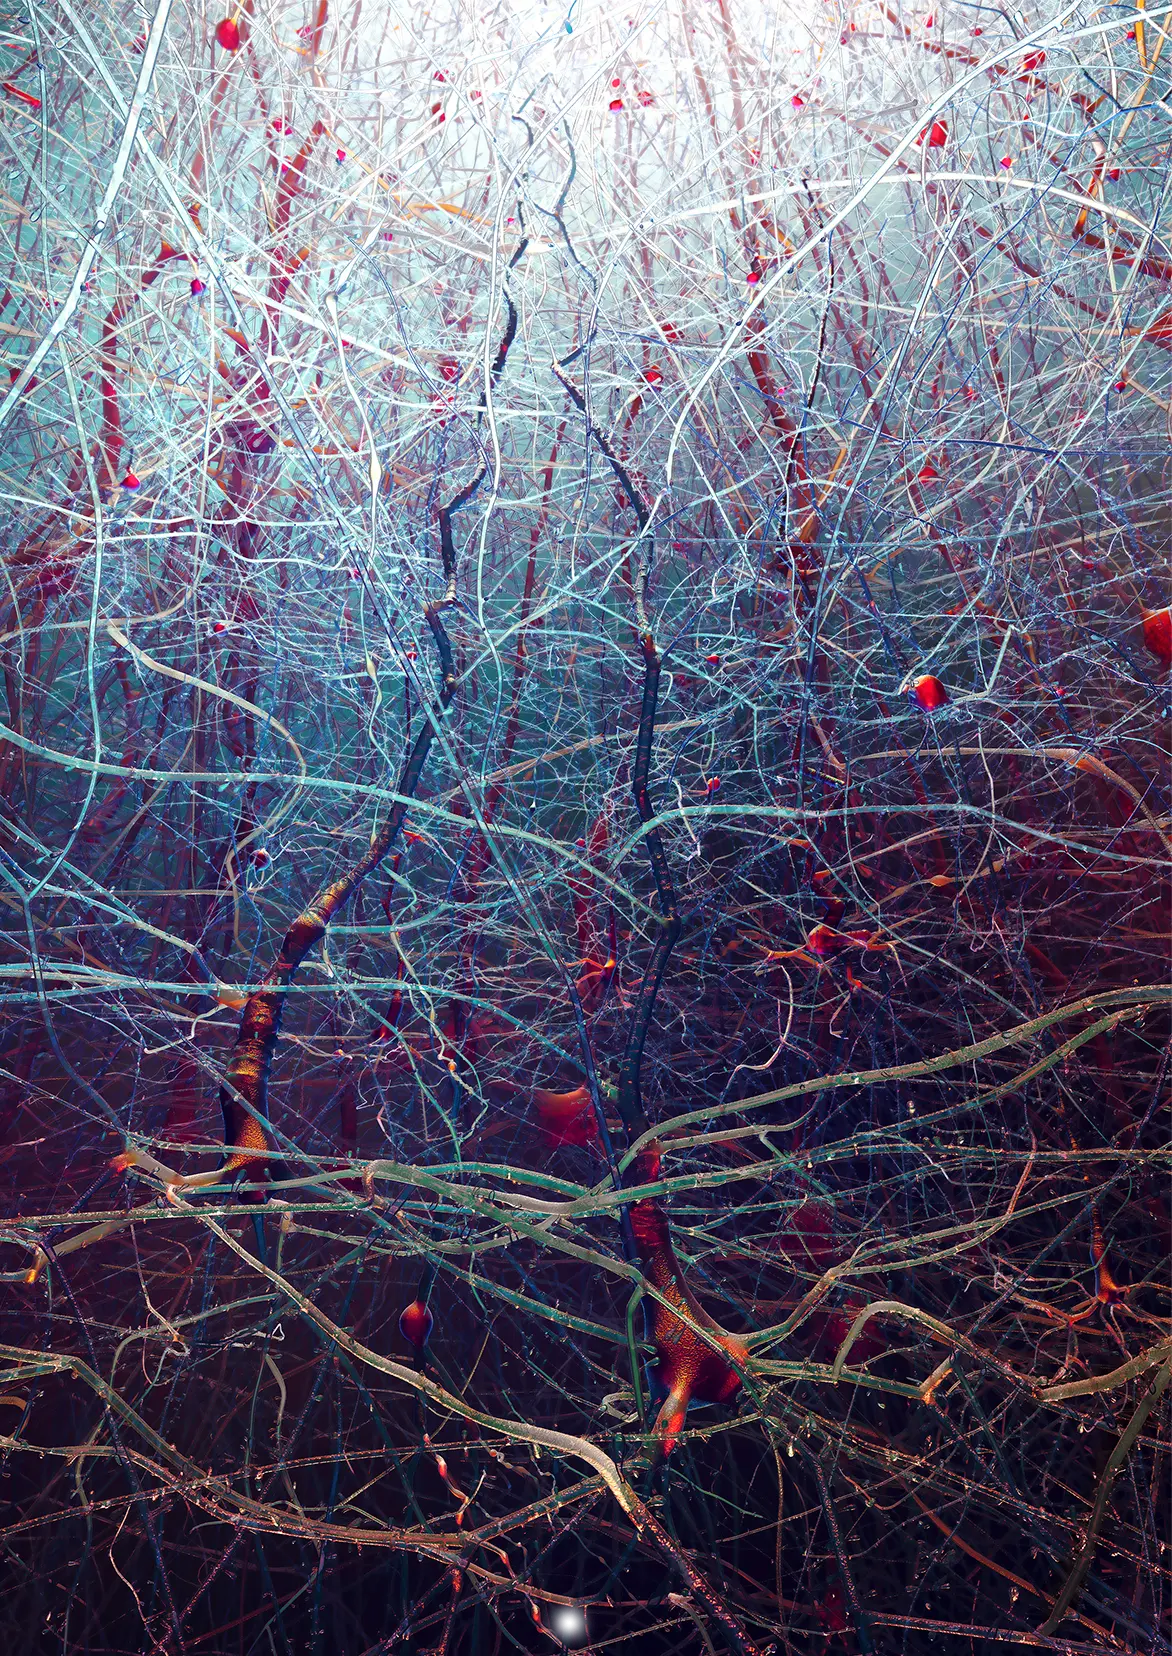
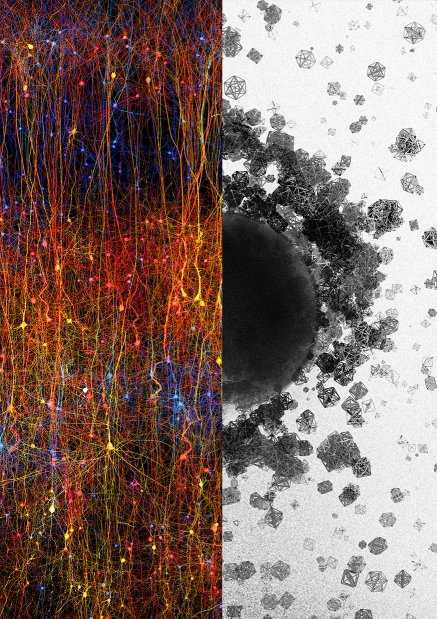
Neuronal simulation data on 3D reconstruction appears on Cell journal cover

This was created almost 3 years ago and yet it ends up on the current issue of Cell scientific journal. Given skeleton data and simulation data by Dura-Bernal laboratory for this neocortical circuit, I worked on the automatic 3D reconstruction and visualization of this research.
See Cell vol 42 issue 6. More info about the research at New York University Dura-Bernal lab and the related scientific publication on multiscale model of primary motor cortex circuits predicts in vivo cell-type-specific, behavioral state-dependent dynamics.
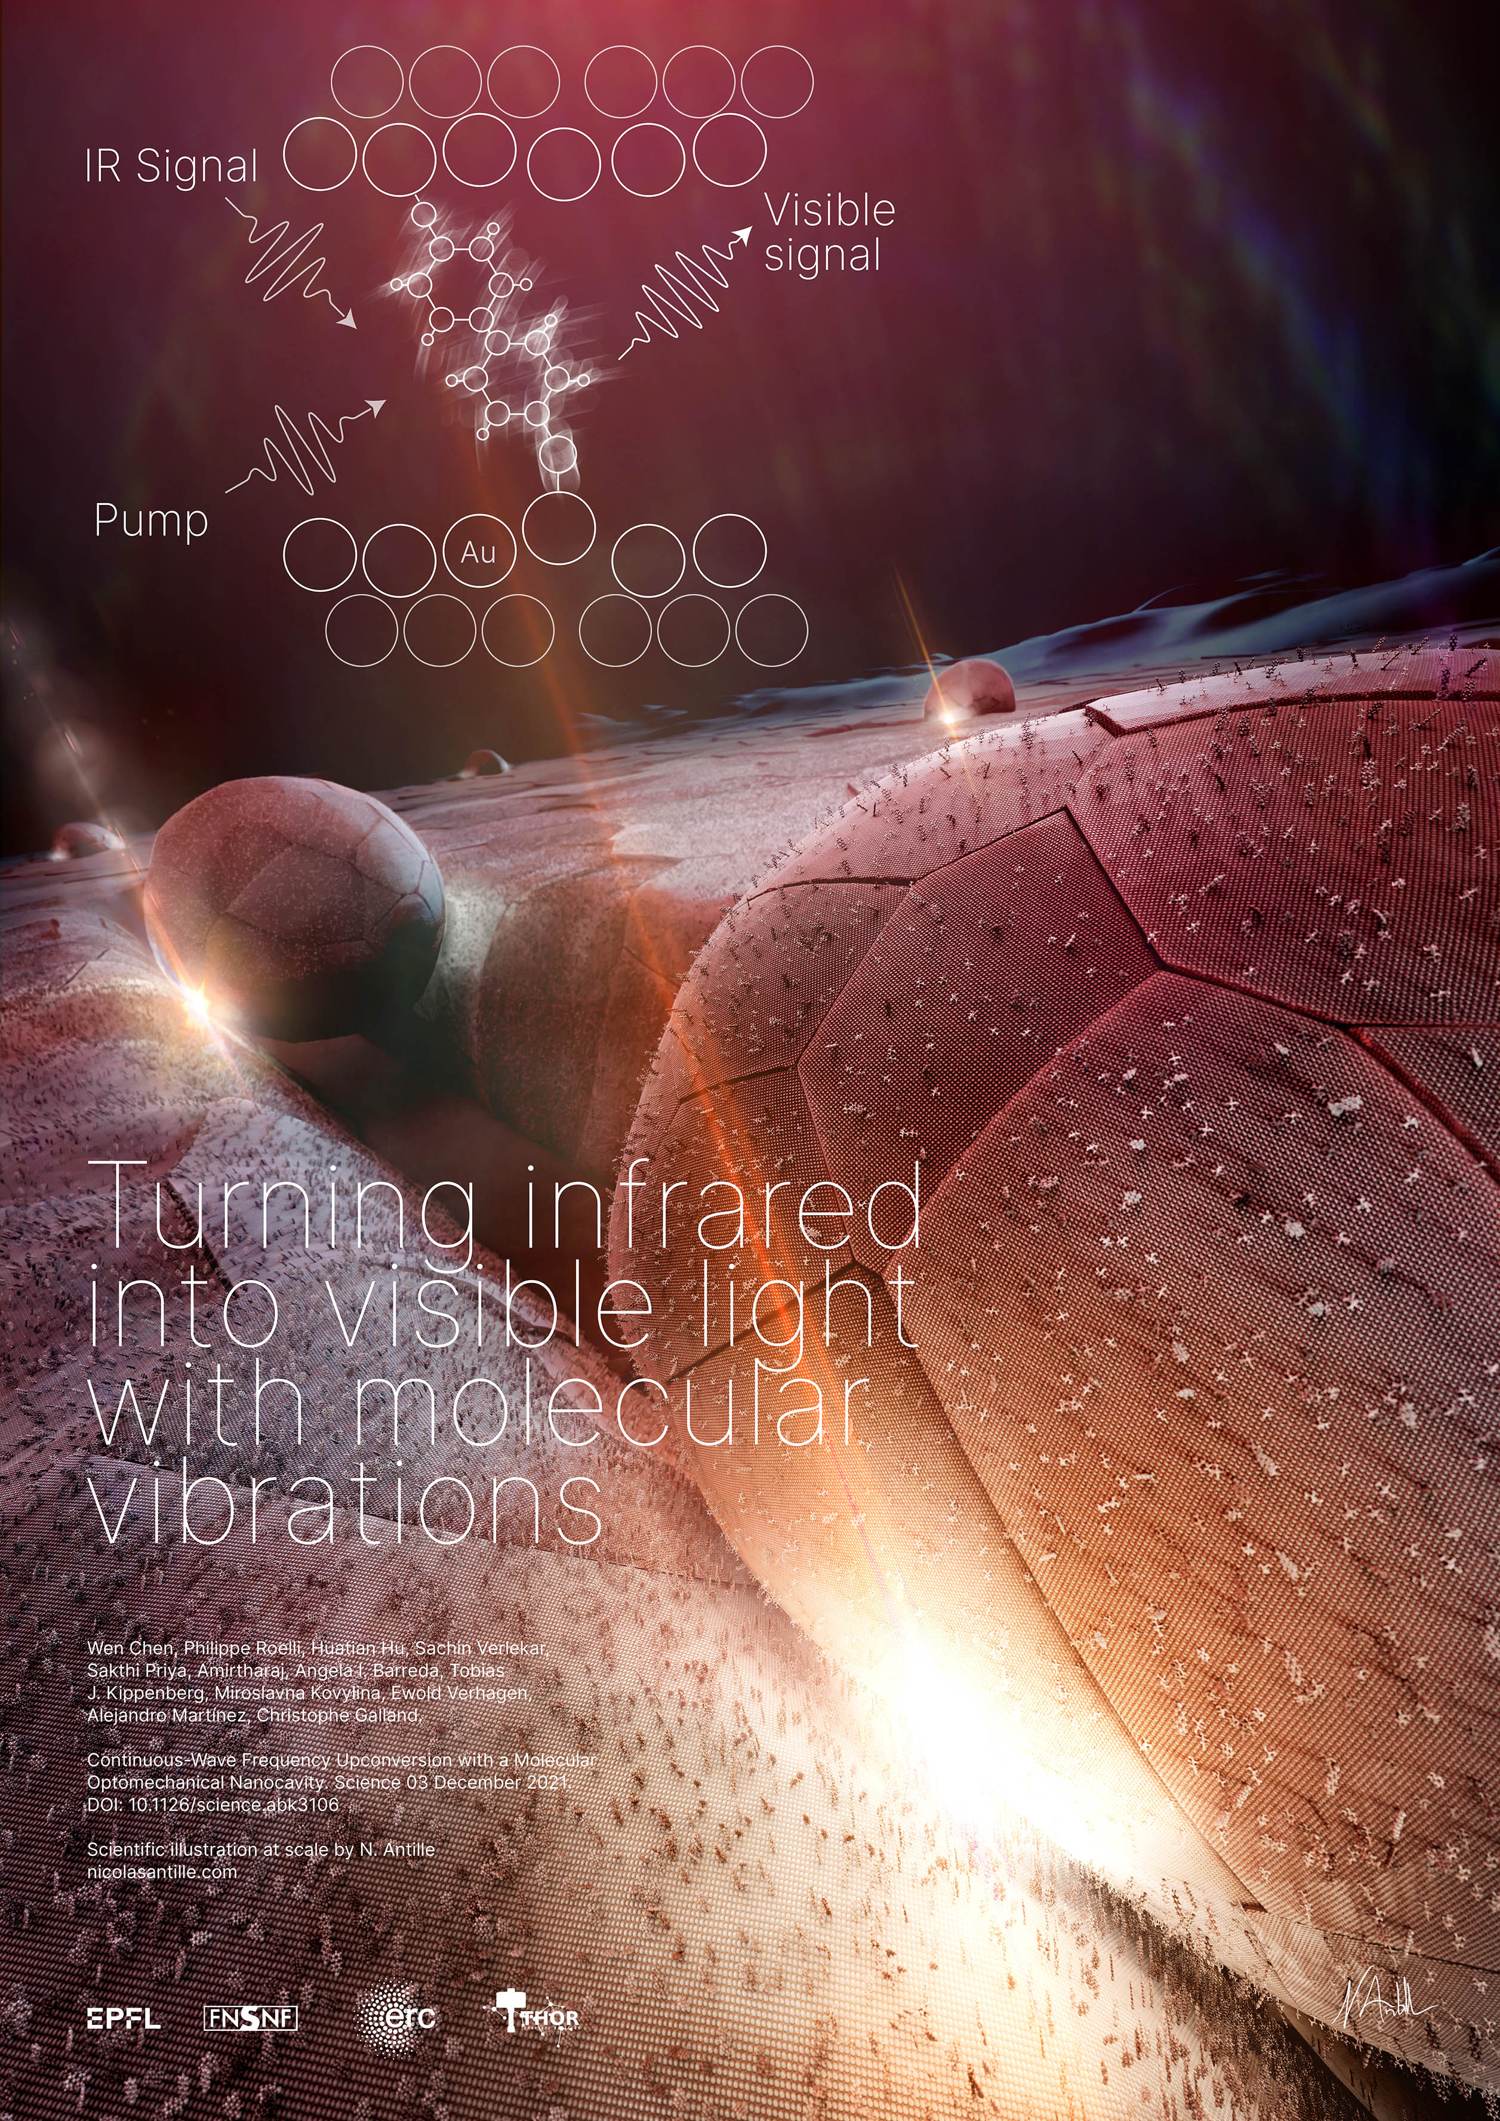
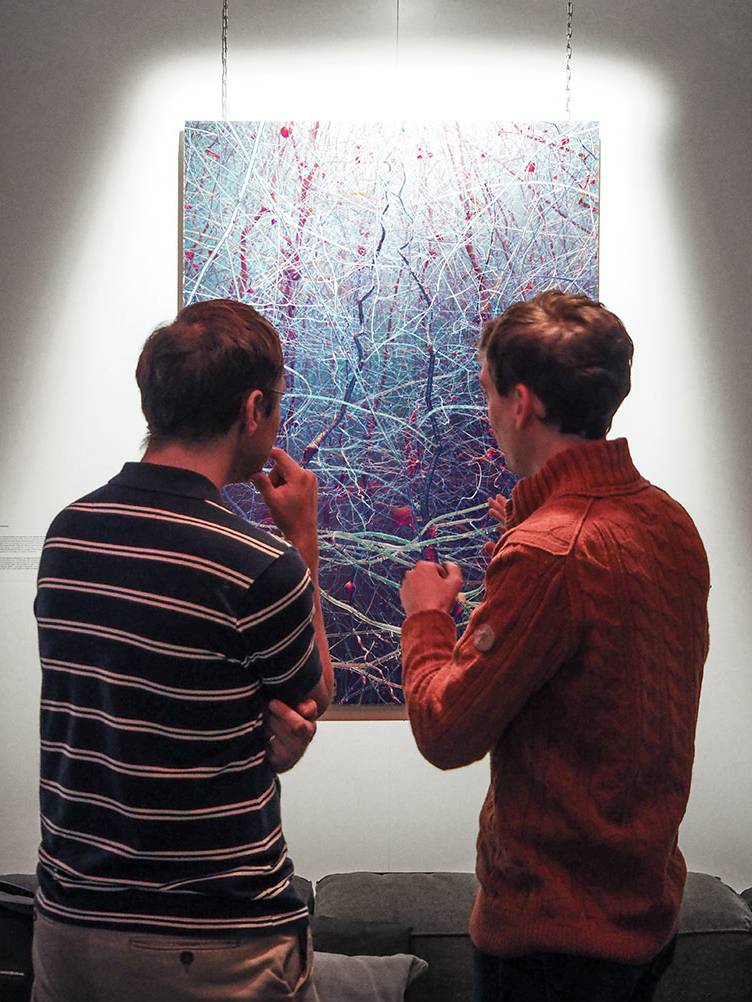
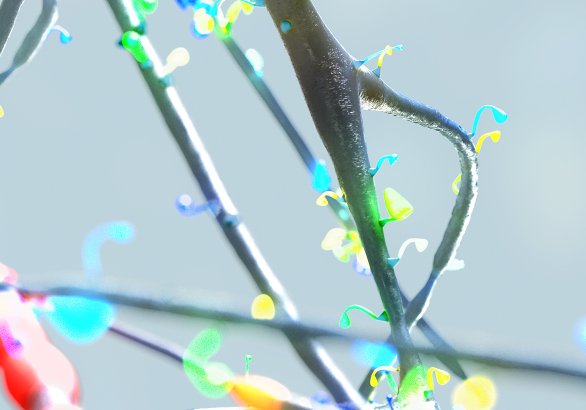
Plasmonic upconversion of molecular vibration into light
Once in a while, I create scientific illustrations rather than data visualizations. Here I was requested to illustrate the research of Professor Galland, LQNO [Laboratory of Quantum and Nano-Optics] lab at EPFL. They managed to create a nano device that turns molecular vibrations excited by specific infrared wavelengths into visible light wavelengths. By asking relevant questions to recreate a 3D scene that is close to reality, I then designed this landscape with ridges. All is gold sprinkled with some other types of molecules which, in the gap between the nano-particle of gold and the ridge, have the specific property of changing a given invisible wavelength to a visible one.
See the related 2021 publication: Continuous-wave frequency upconversion with a molecular optomechanical nanocavity
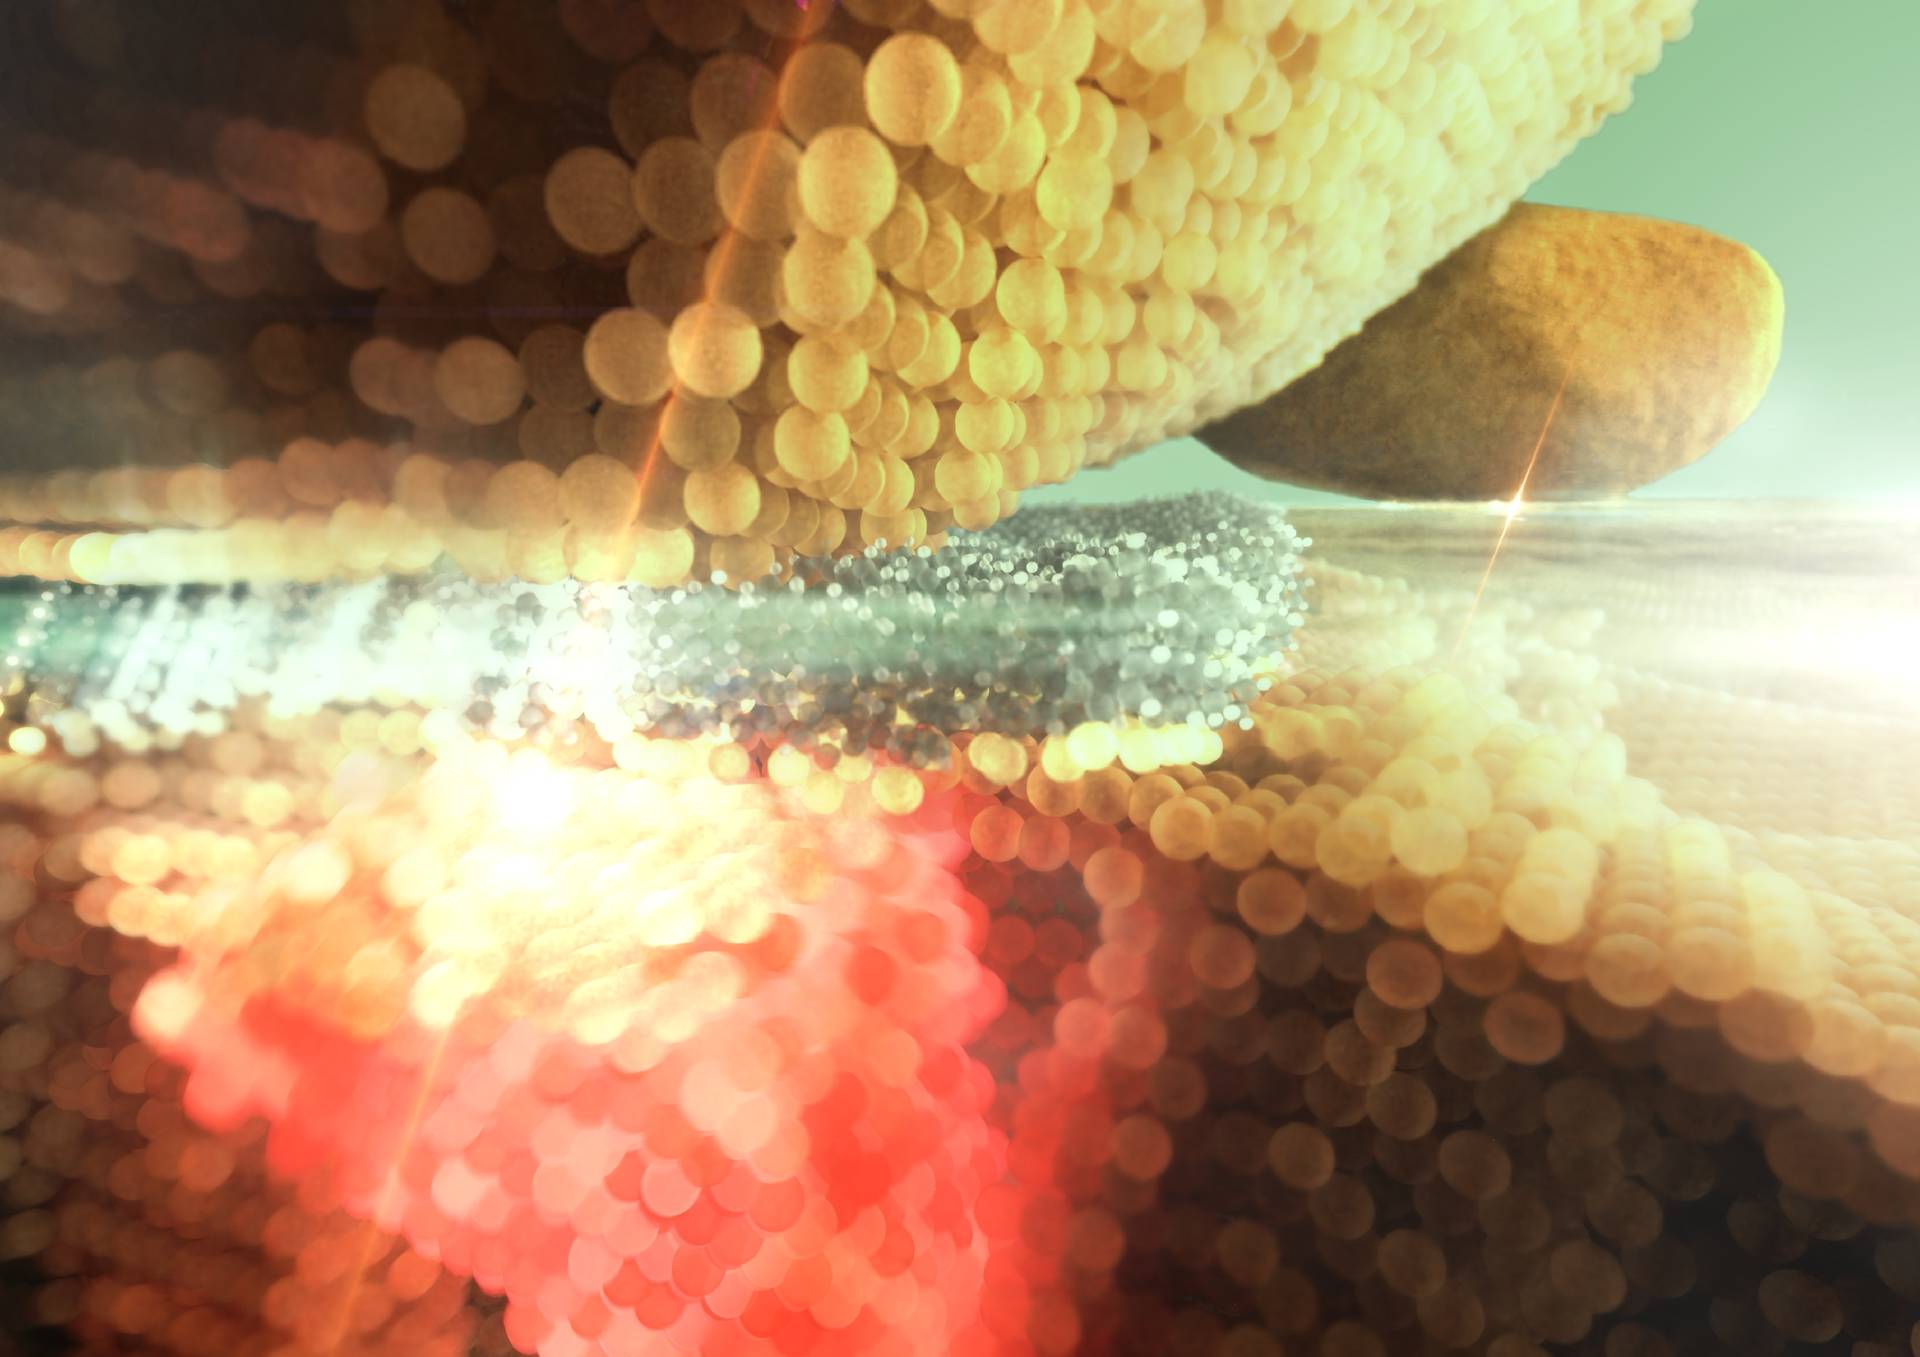
Molecular cavity optomechanics illustration where atoms are sliced to better see the interaction of light with vibrating molecules in this nano-gap. This illustration was featured on EPFL university news and is also part of the description of the research of LQNO lab.
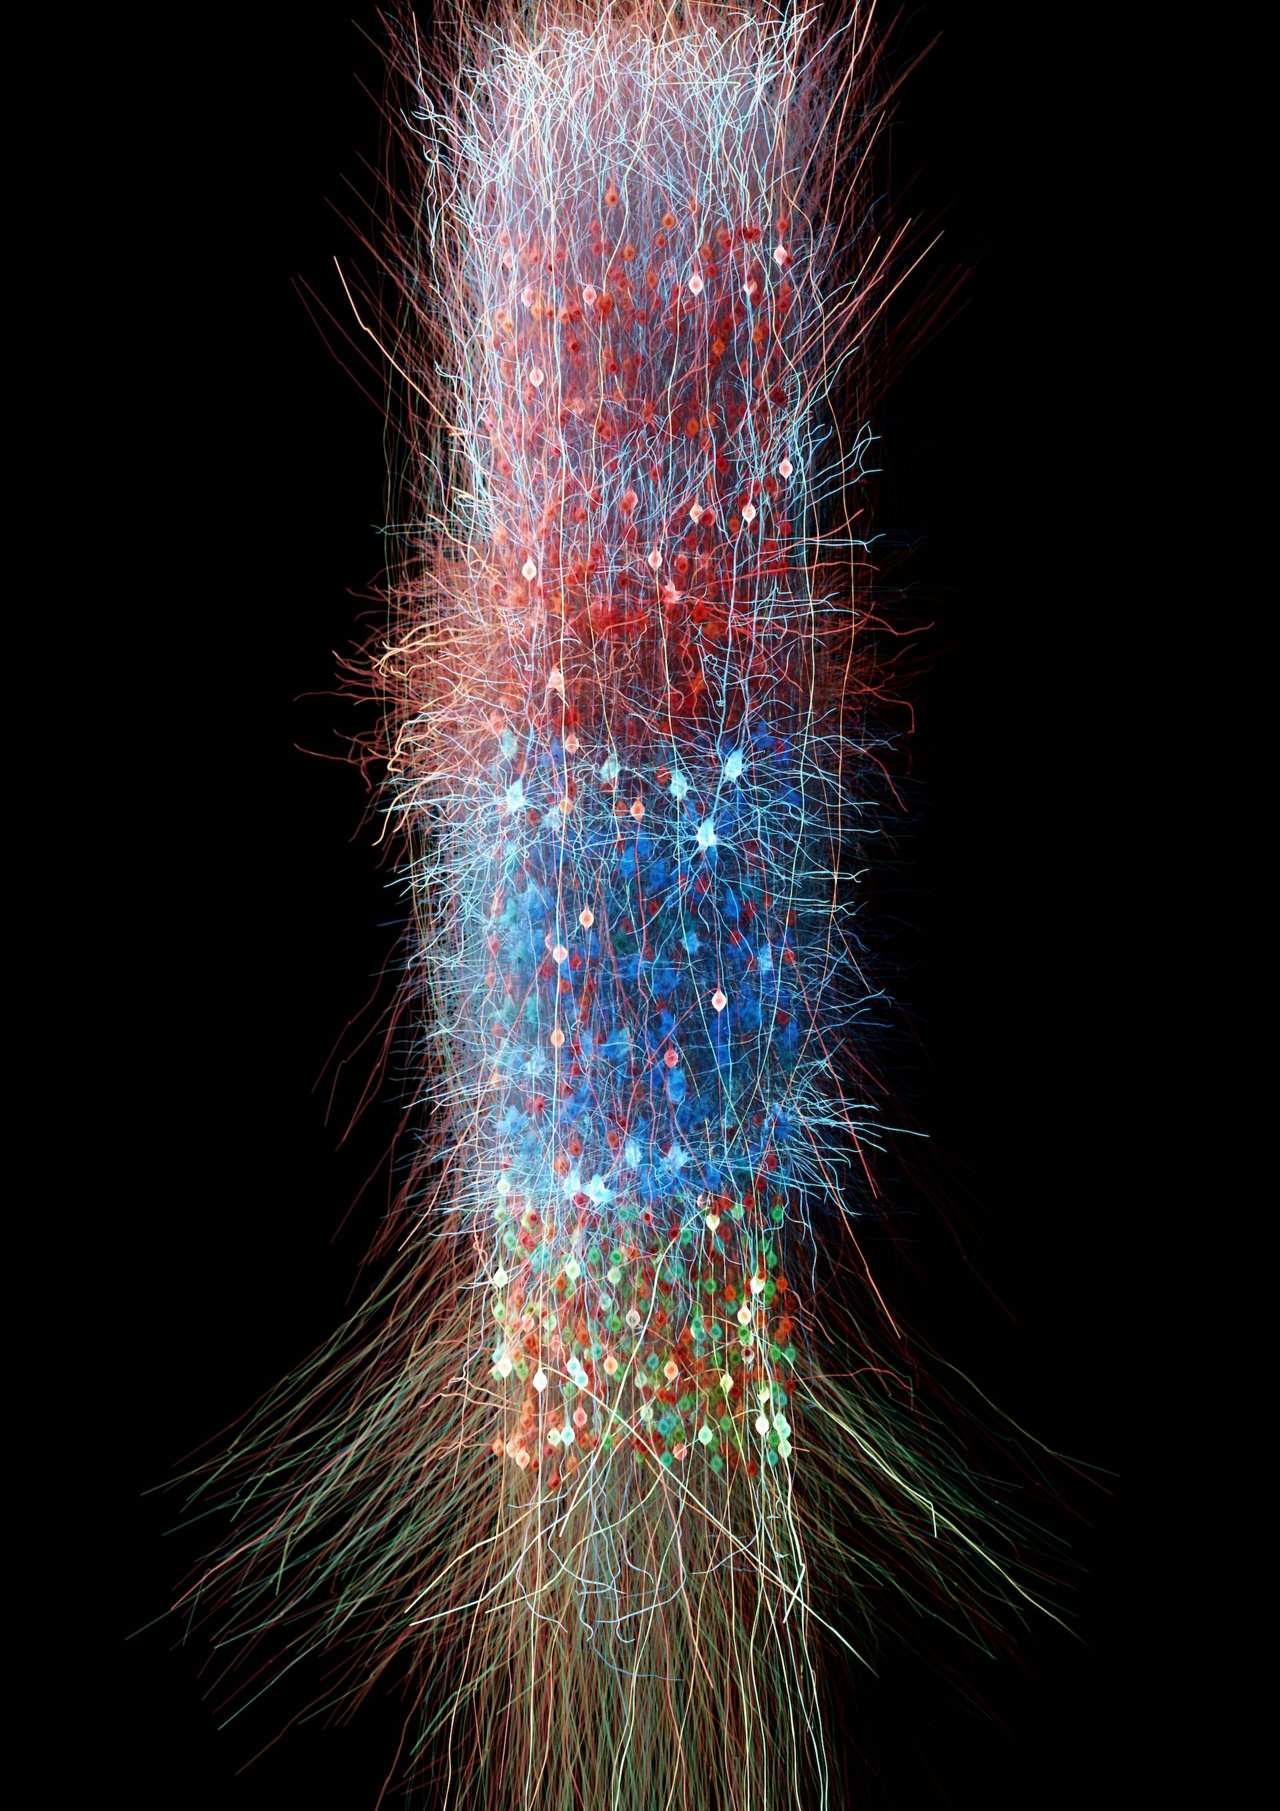
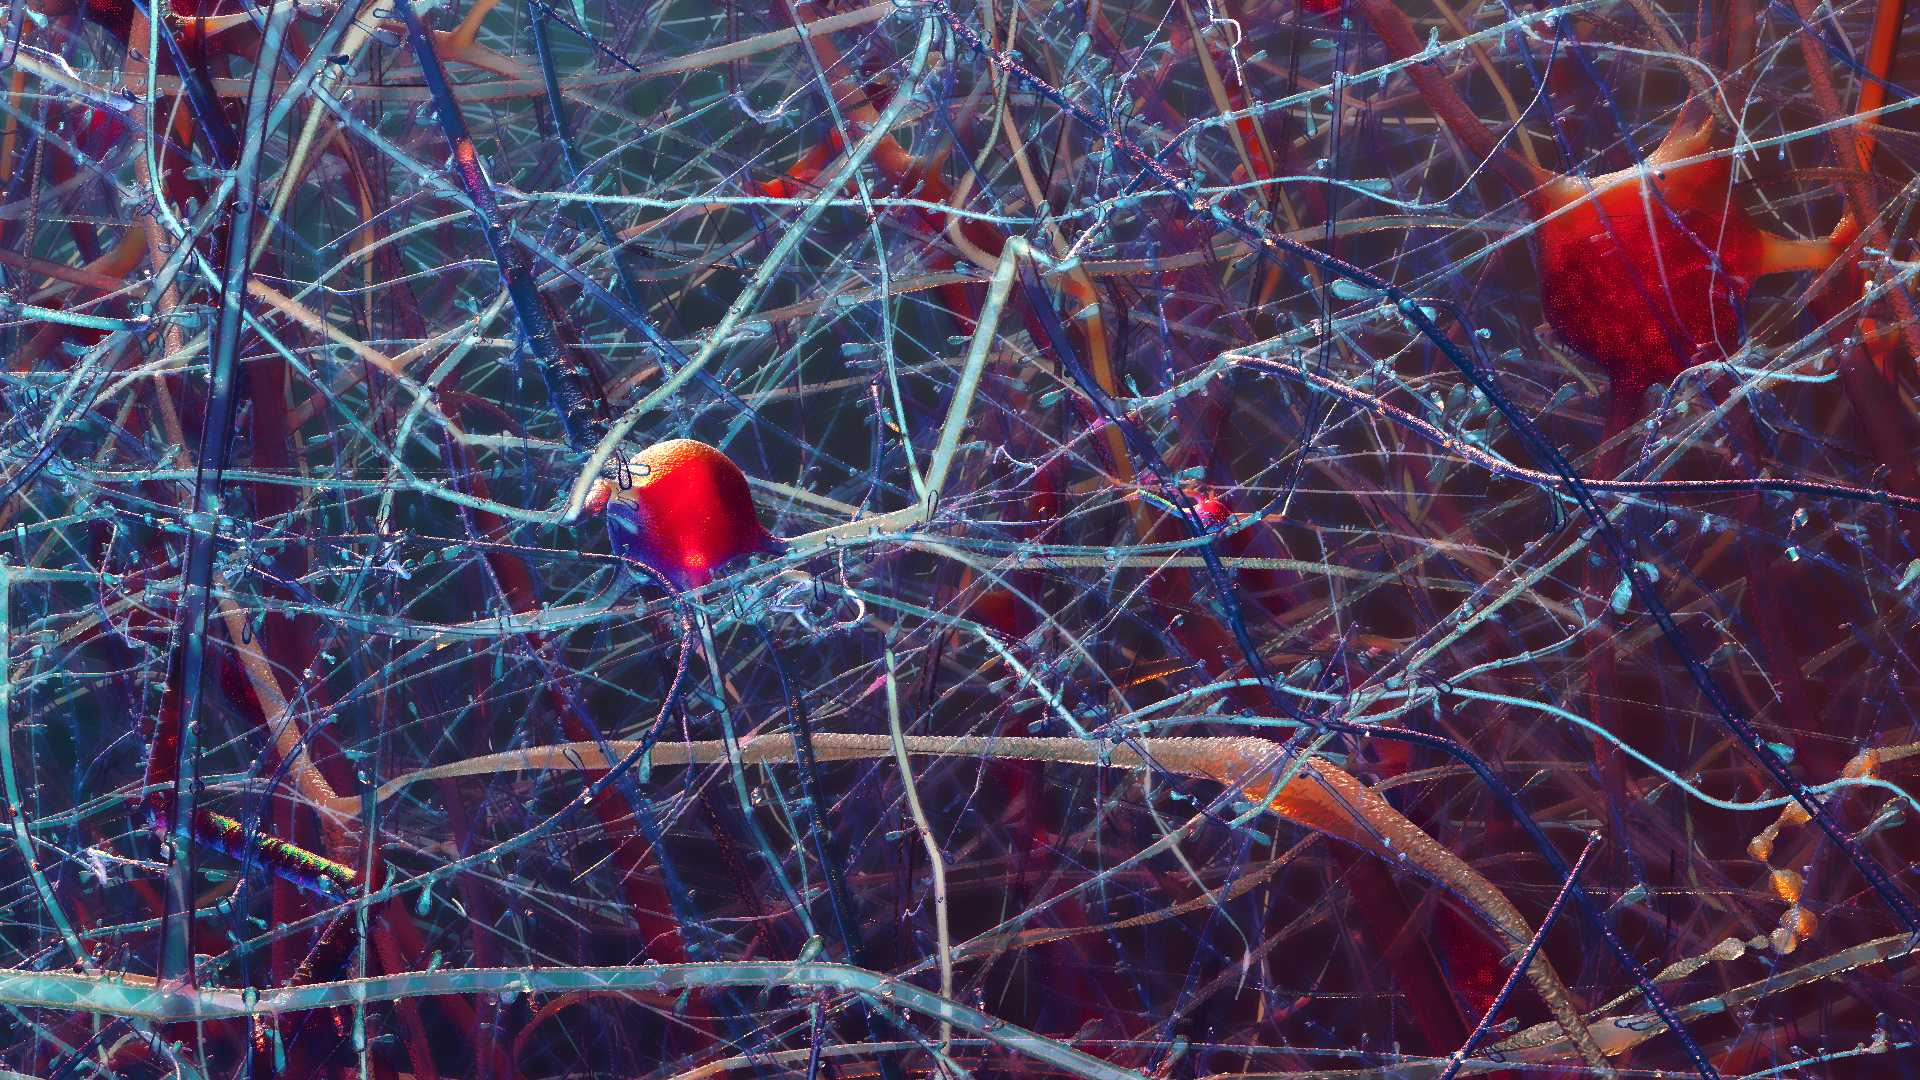
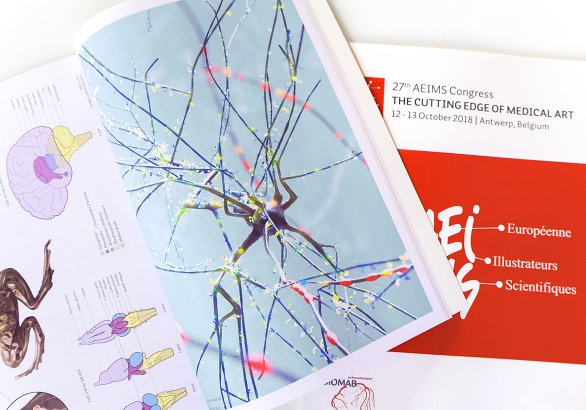
SNSF Scientific Image Competition Audience Award 2017-2021!
It's official: my data visualization of a neocortical forest was elected as best scientific image submitted to SNSF in the past 5 years!
This is an amazing reward for my efforts and vision to present scientific research and data with meaningful and impactful results, in going beyond standards and in bringing visualization to a quality worth inspiring scientists and everyone. Thanks to Swiss National Science Foundation and to the many people who have voted!
> SNSF scientific image awards
> Official SNSF announcement> Festival of Photography Biel
The Award ceremony will take place at Zürich Film Festival on Wednesday 29th of September, 5-7pm, Folium, Sihlcity, Kalanderplatz 6, 8045 Zürich.
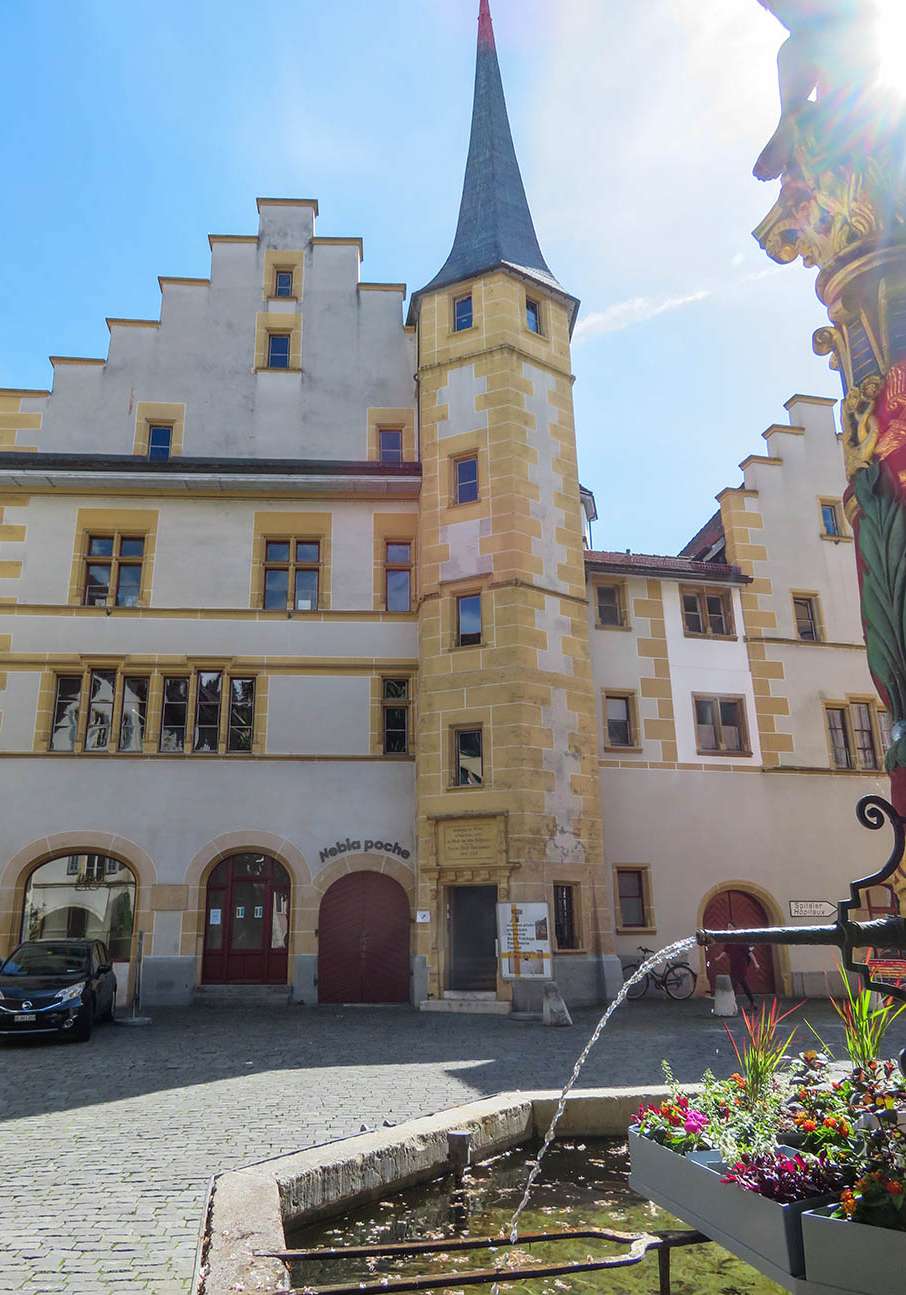
My visualization was presented as the first large image in a dedicated picturesque building at Biel/Bienne Festival of Photography. Moreover, the 3D reconstruction of a lizard I made was presented on another wall together with the other runner ups.
Selected in runner up(s) for SNSF Image Competition 2021
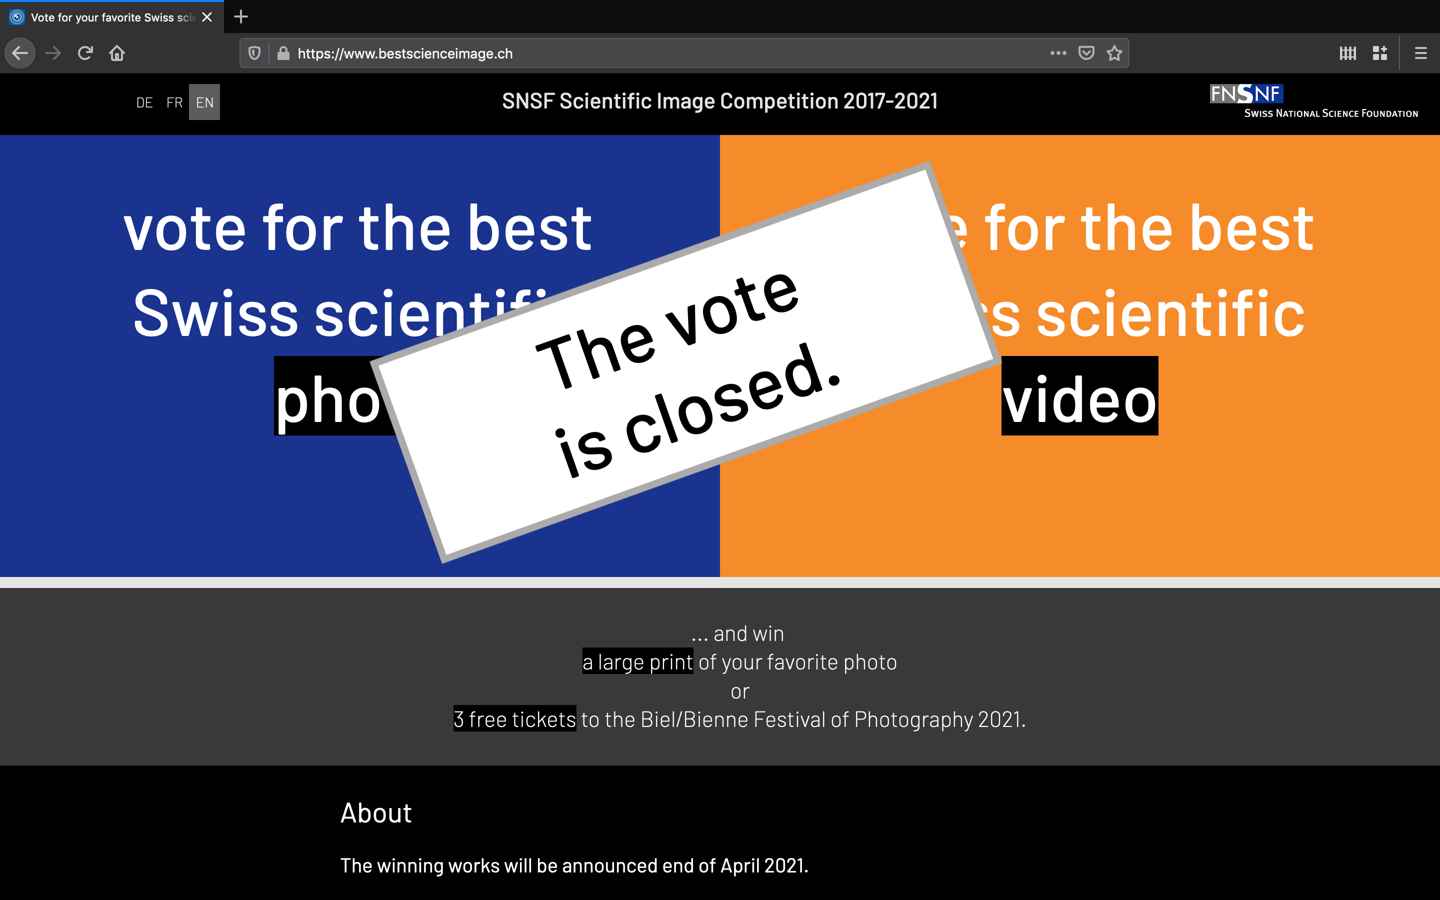
Until March 31st, you may vote for the best scientific image of the past 5 years. >> BestScienceImage.ch
Out of more than 2000 entries, students of the design school of Bern made a selection of 50 images and 15 videos was presented to the public for a vote. The competition was tough within this selection with many great works.
It's not just one but two of my data-driven visualizations that made it in that selection (the Neocortical Forest submitted in 2017 and the Lacerta lizard in 2021). Even if I'm only in the runner ups, I'm already very grateful that the results of my research are inspiring people.
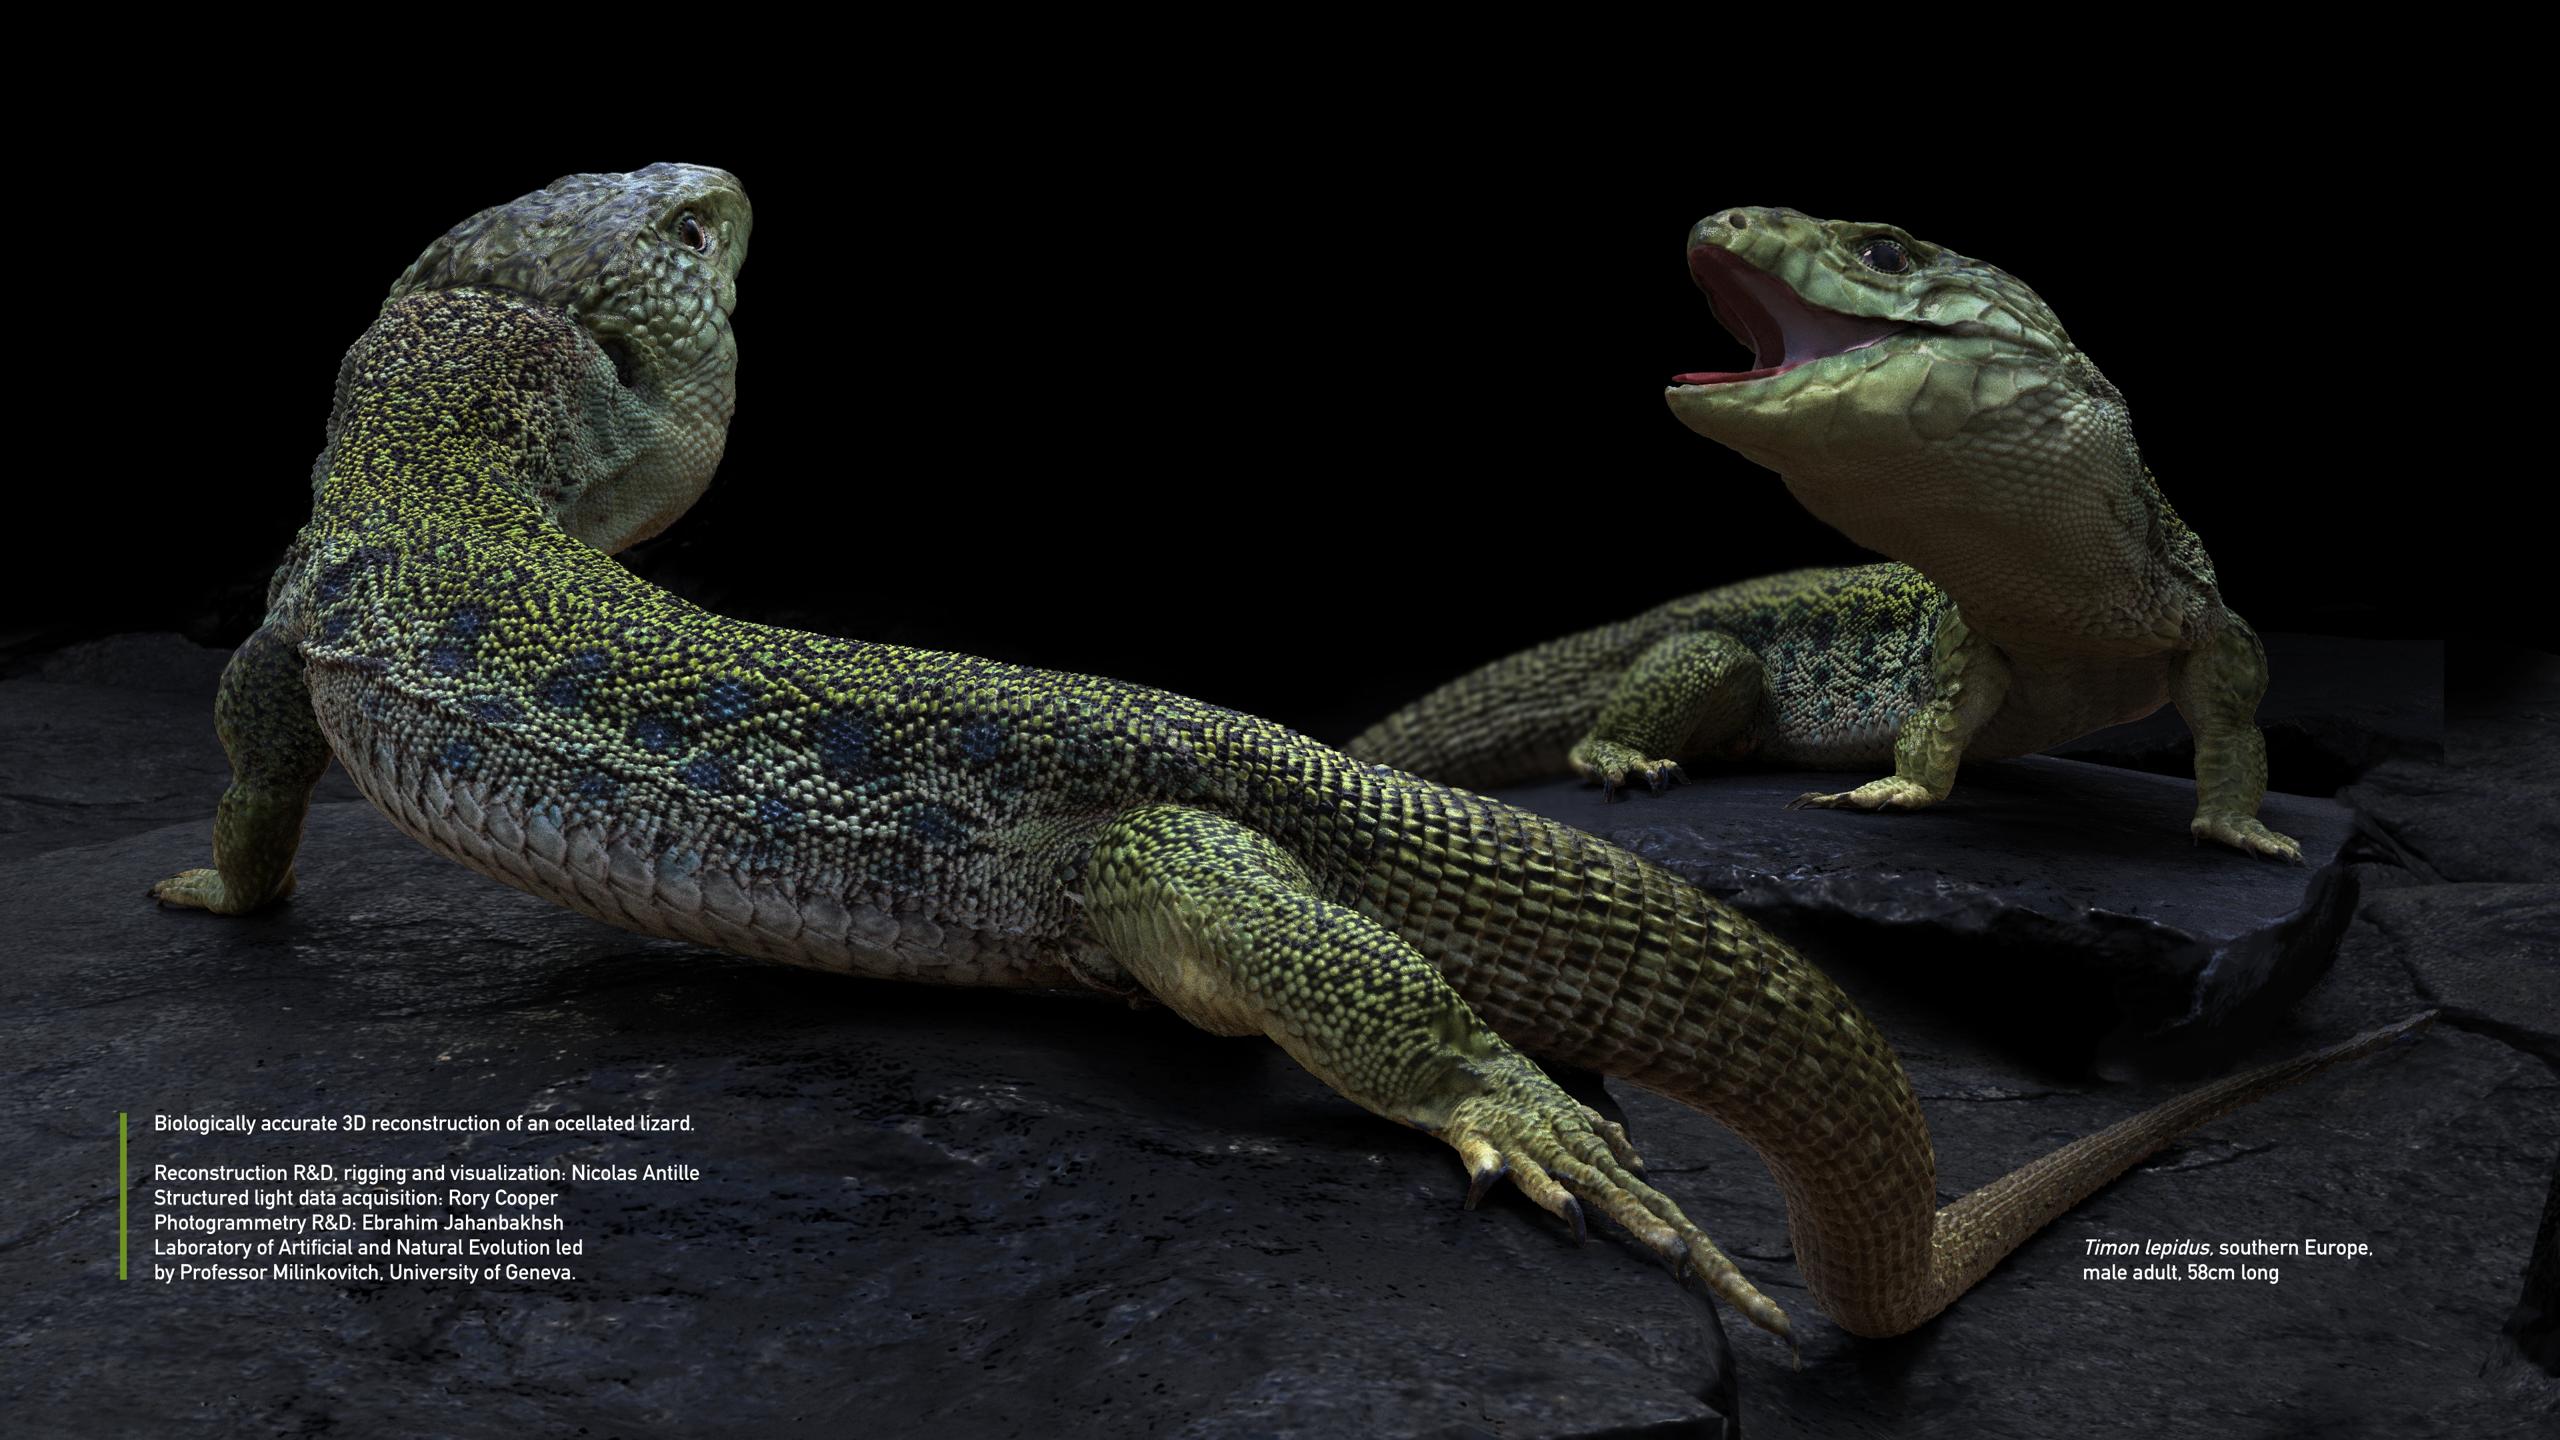
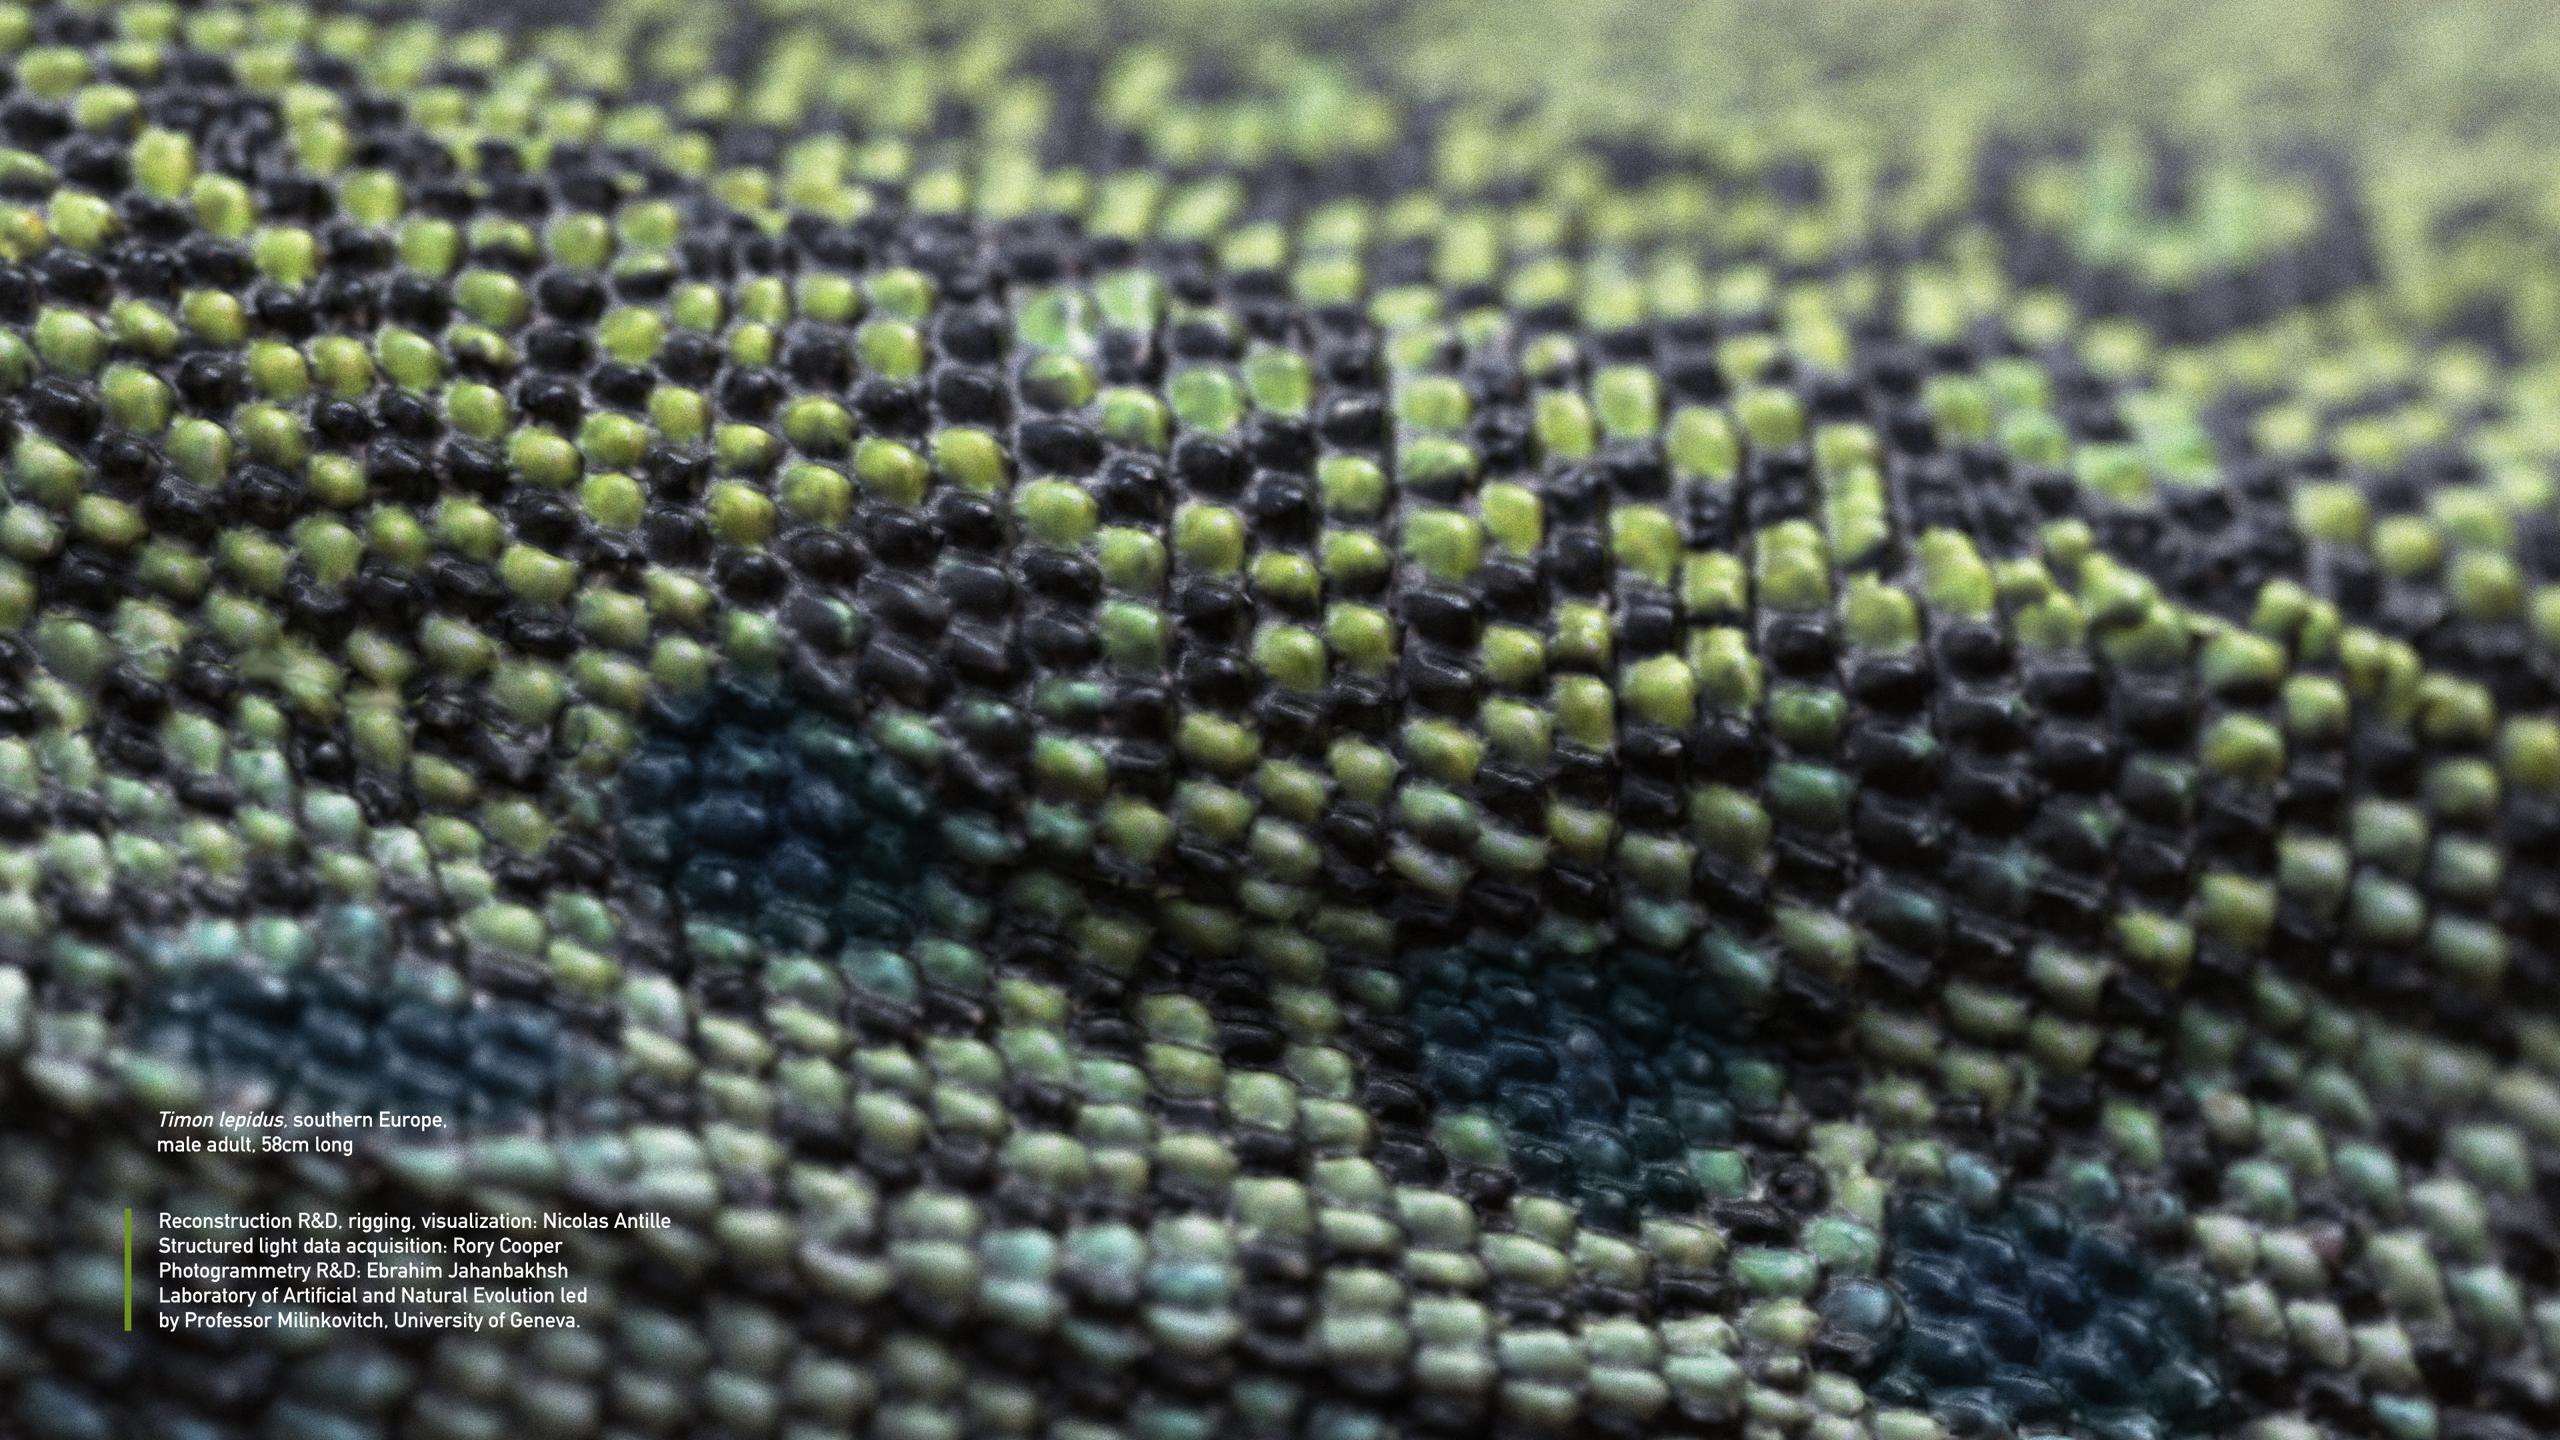
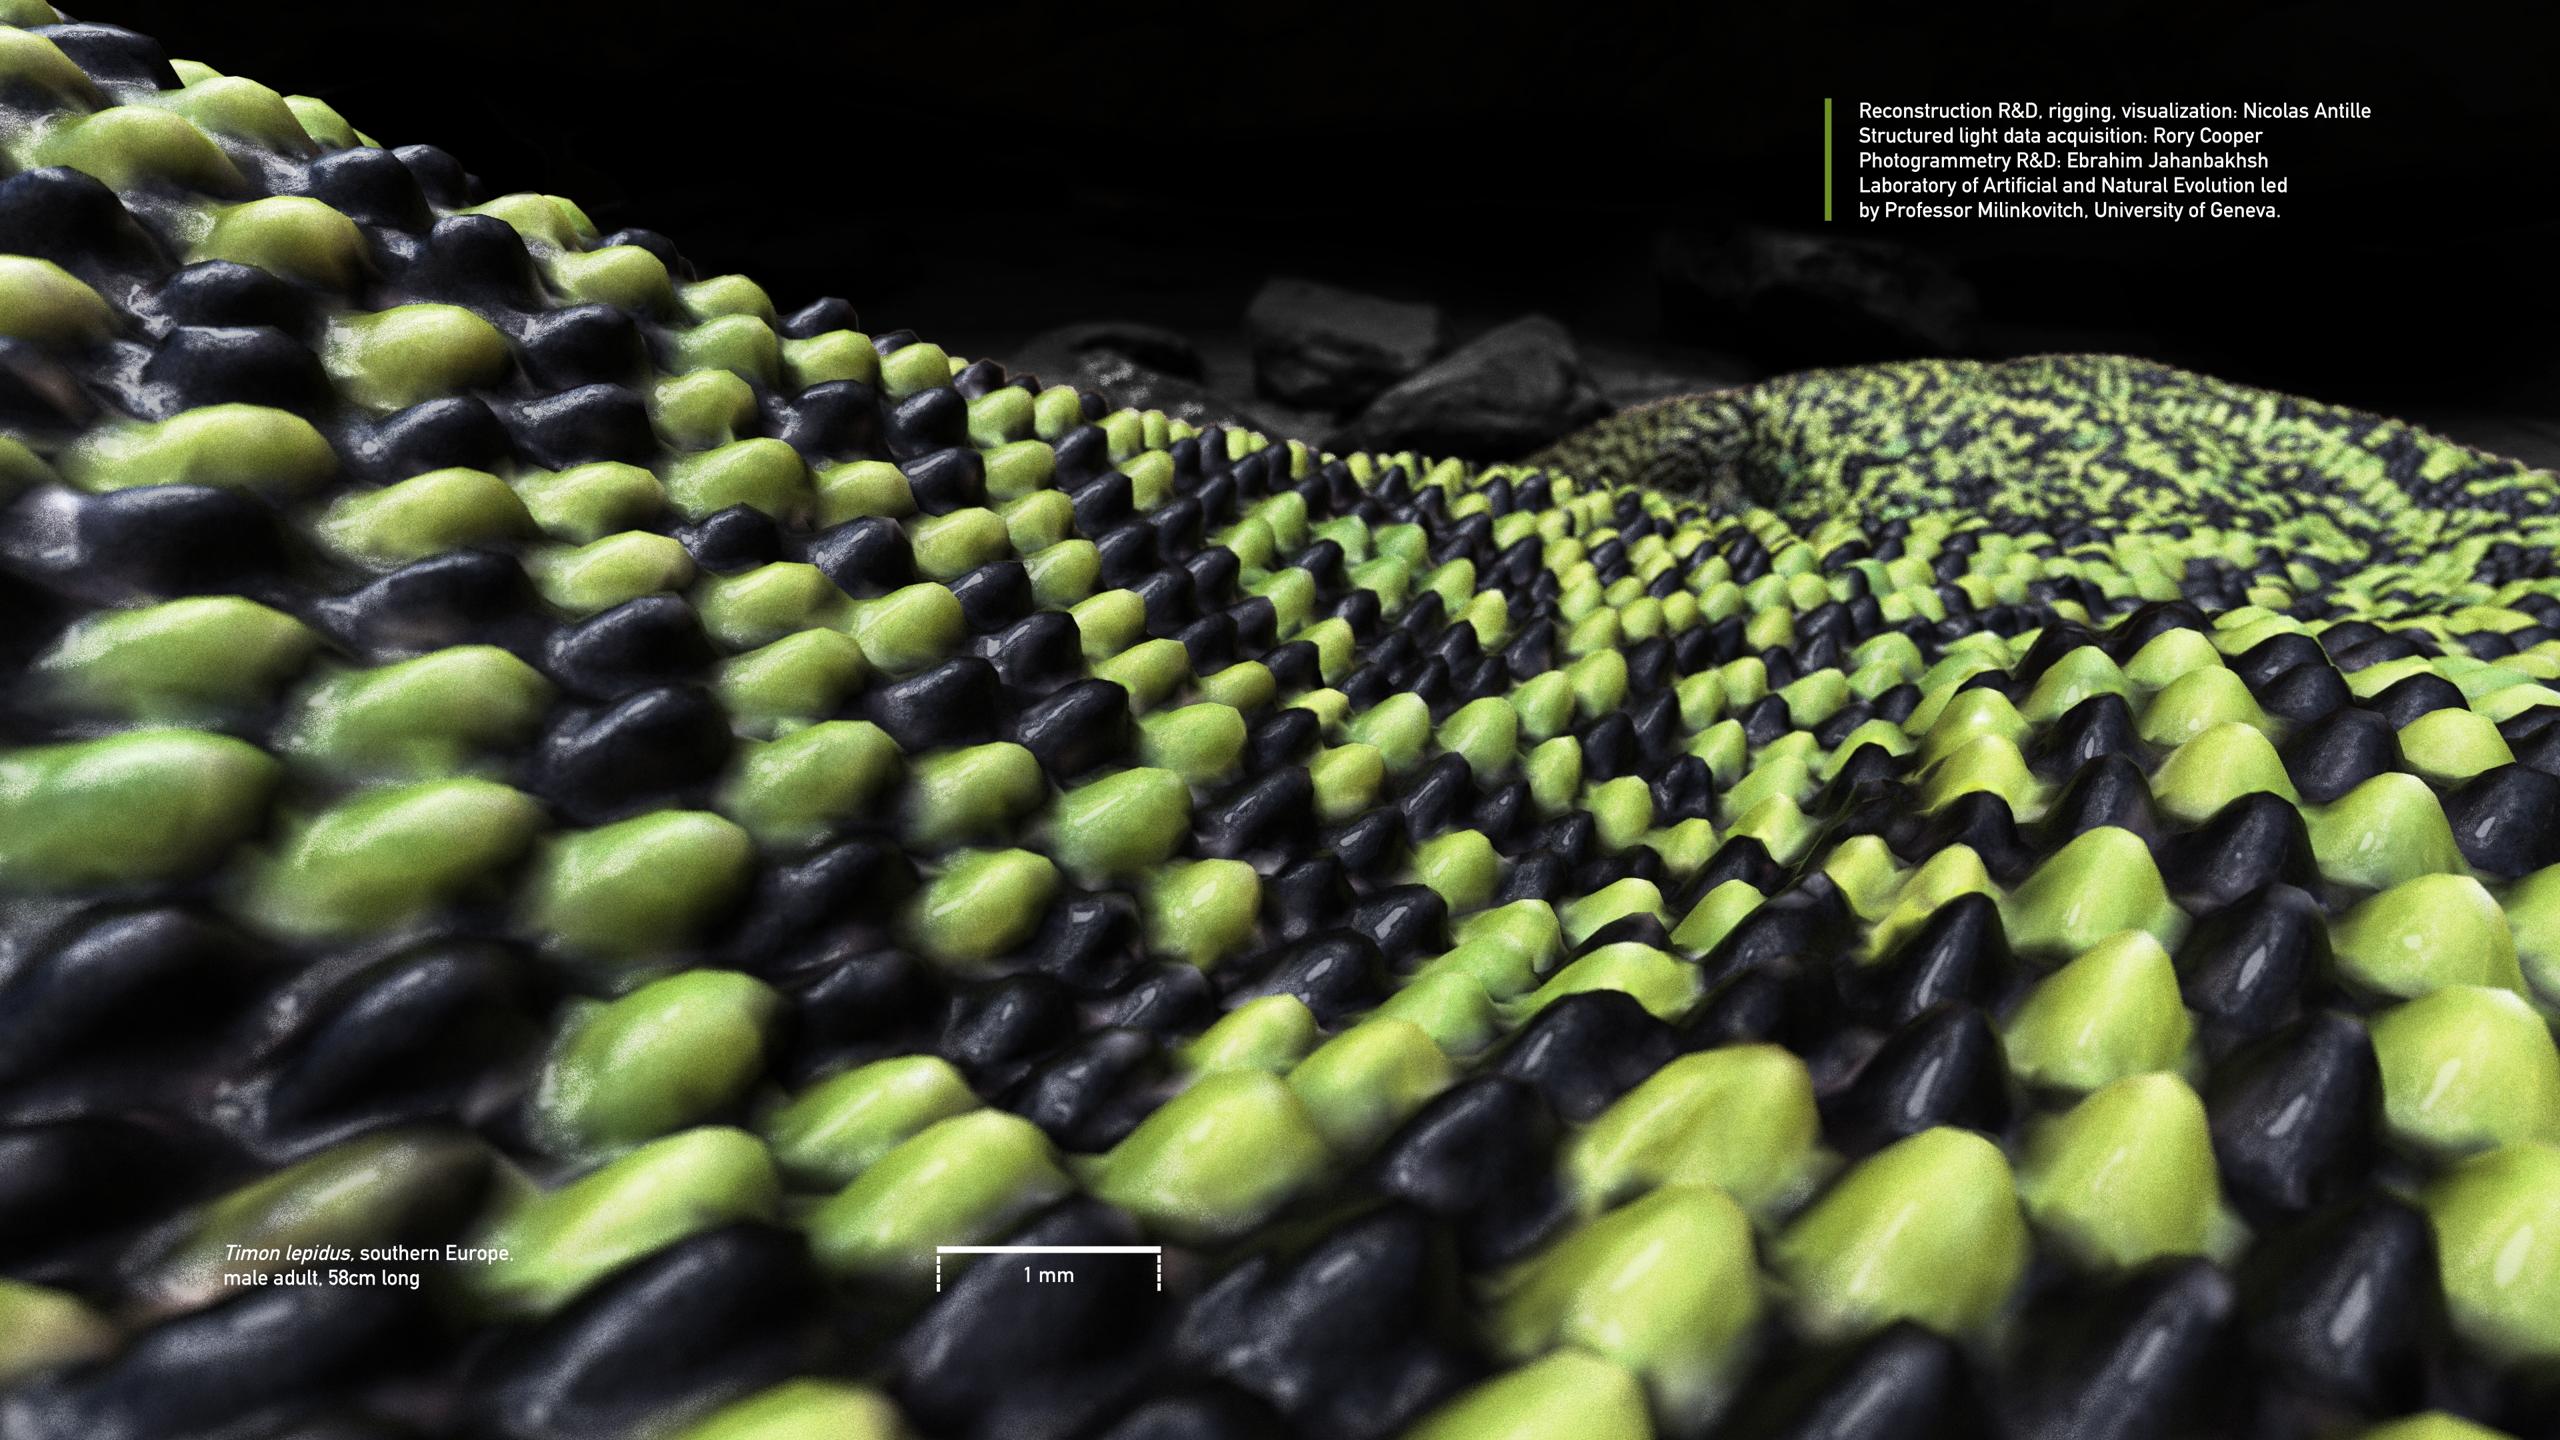
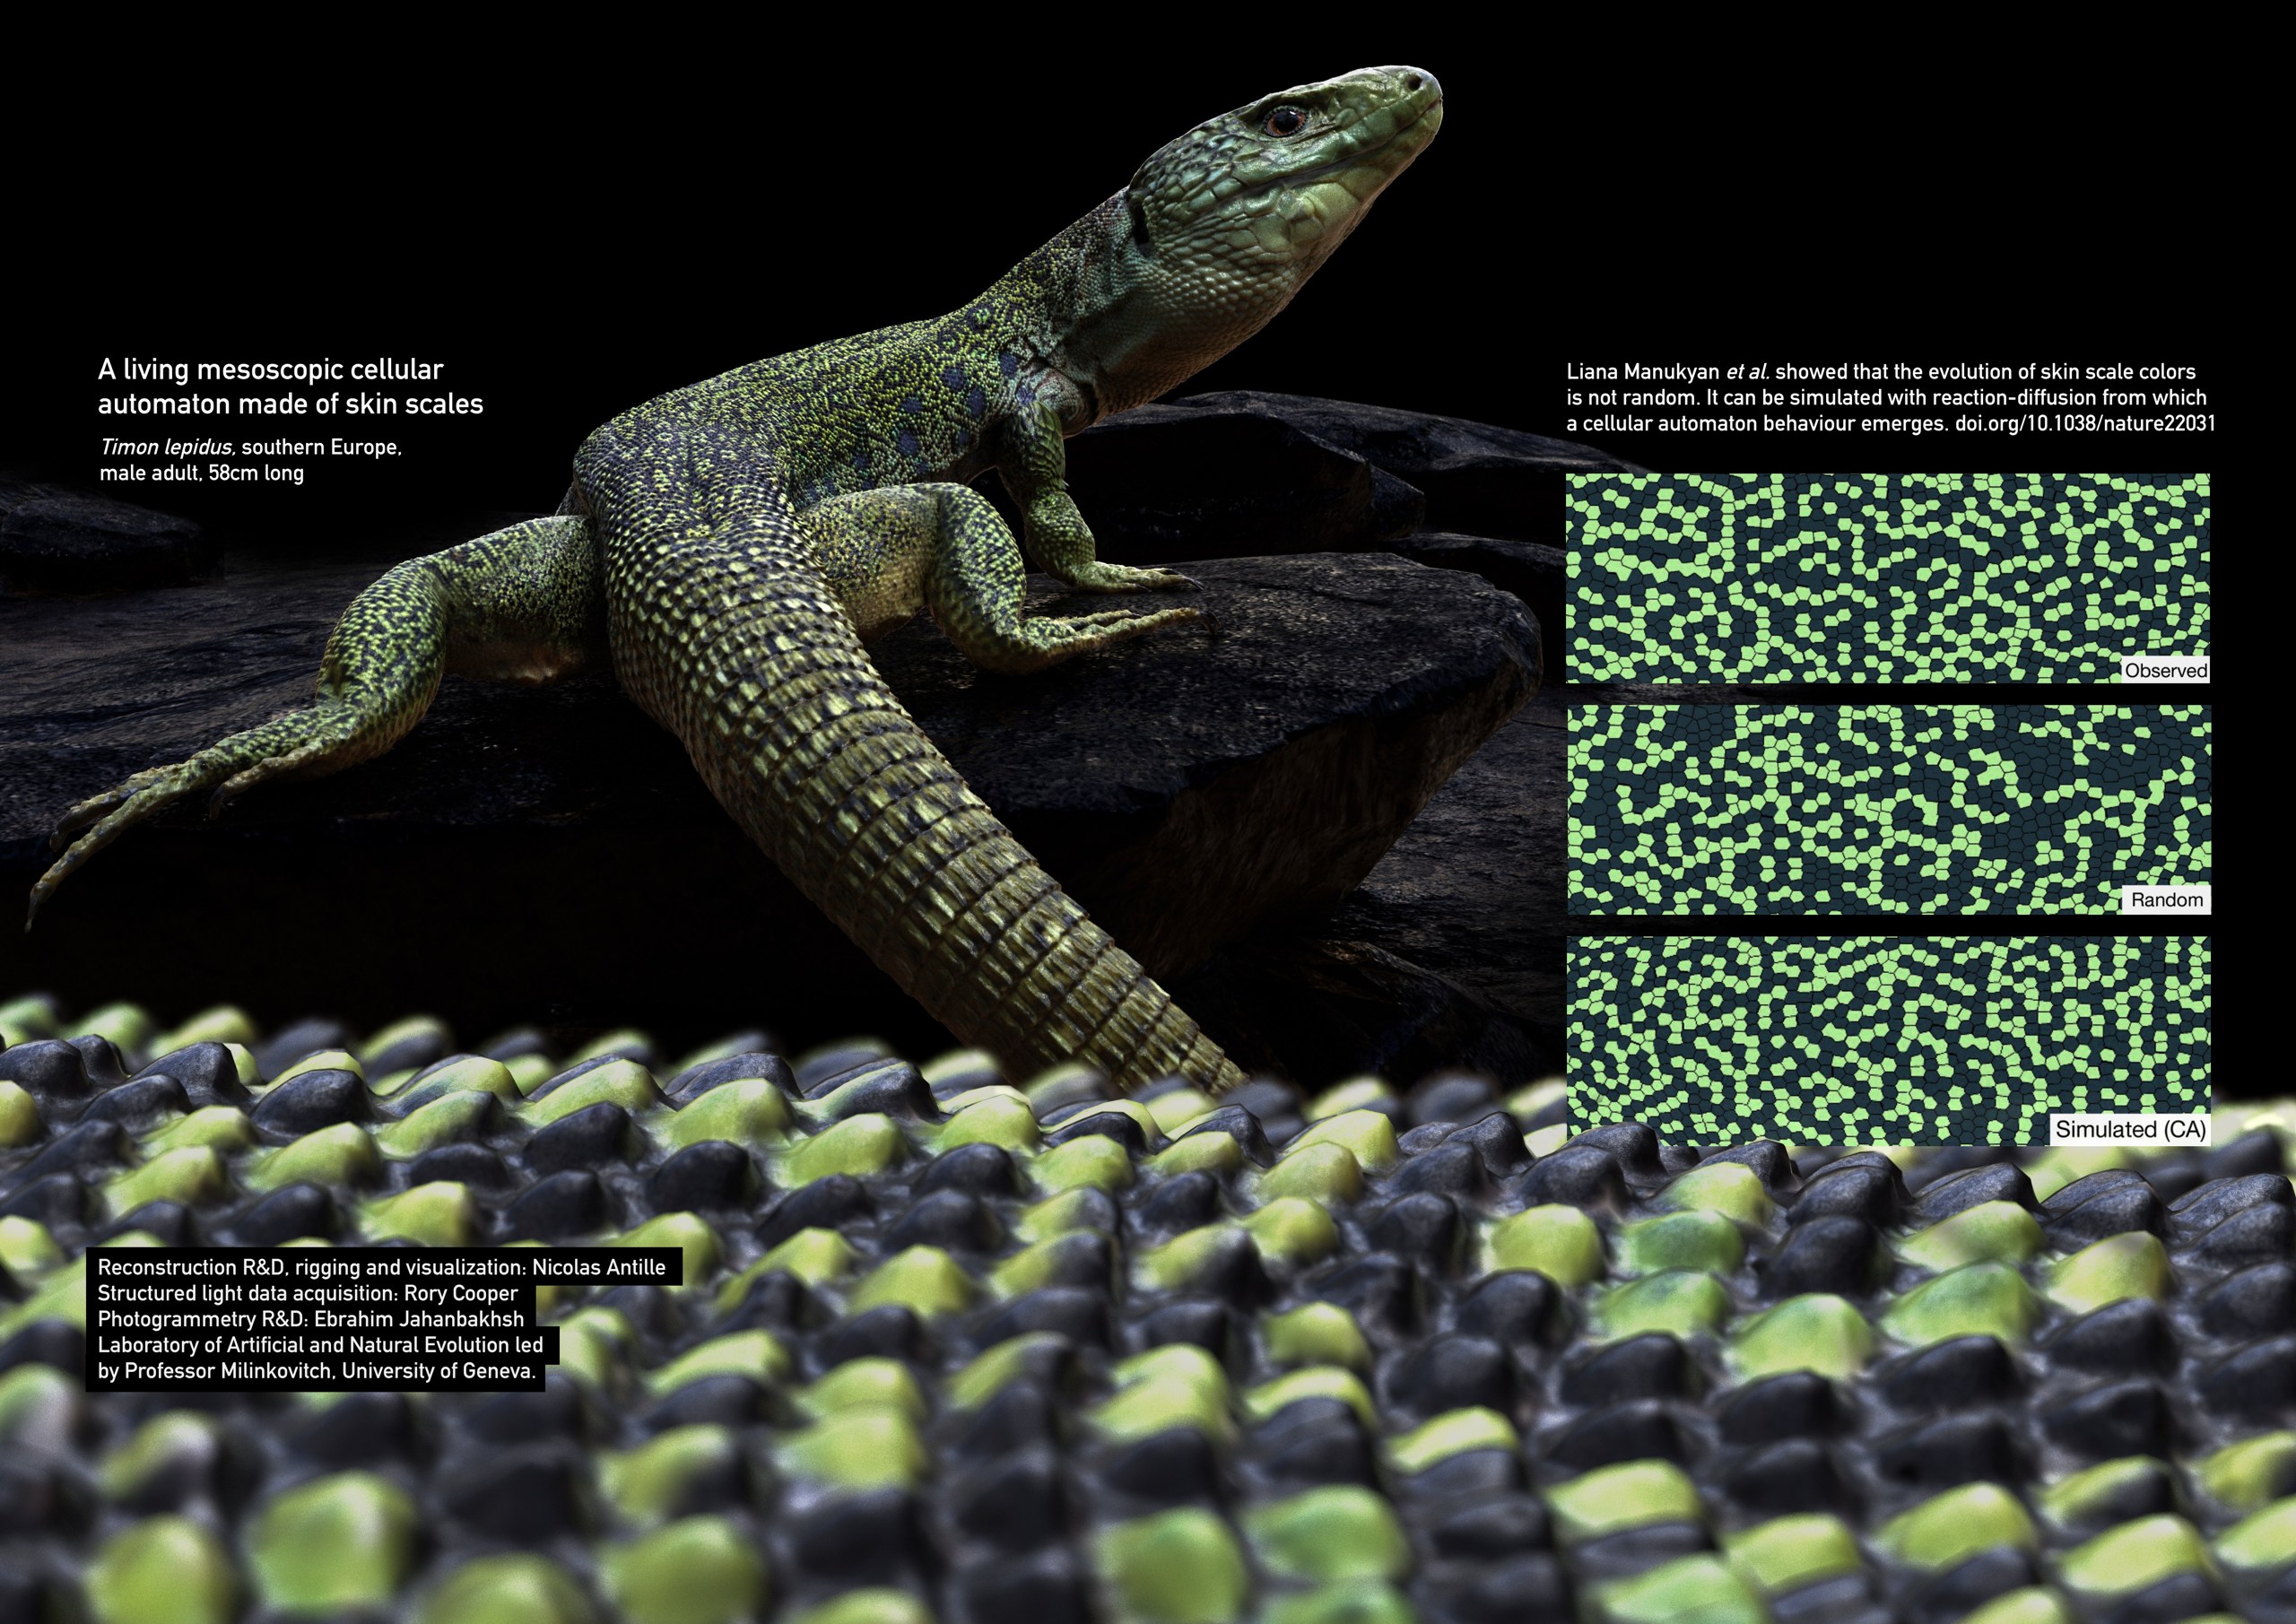
R&D for a highly accurate 3D reconstruction, rigging and visualization of an ocelatted lizard.
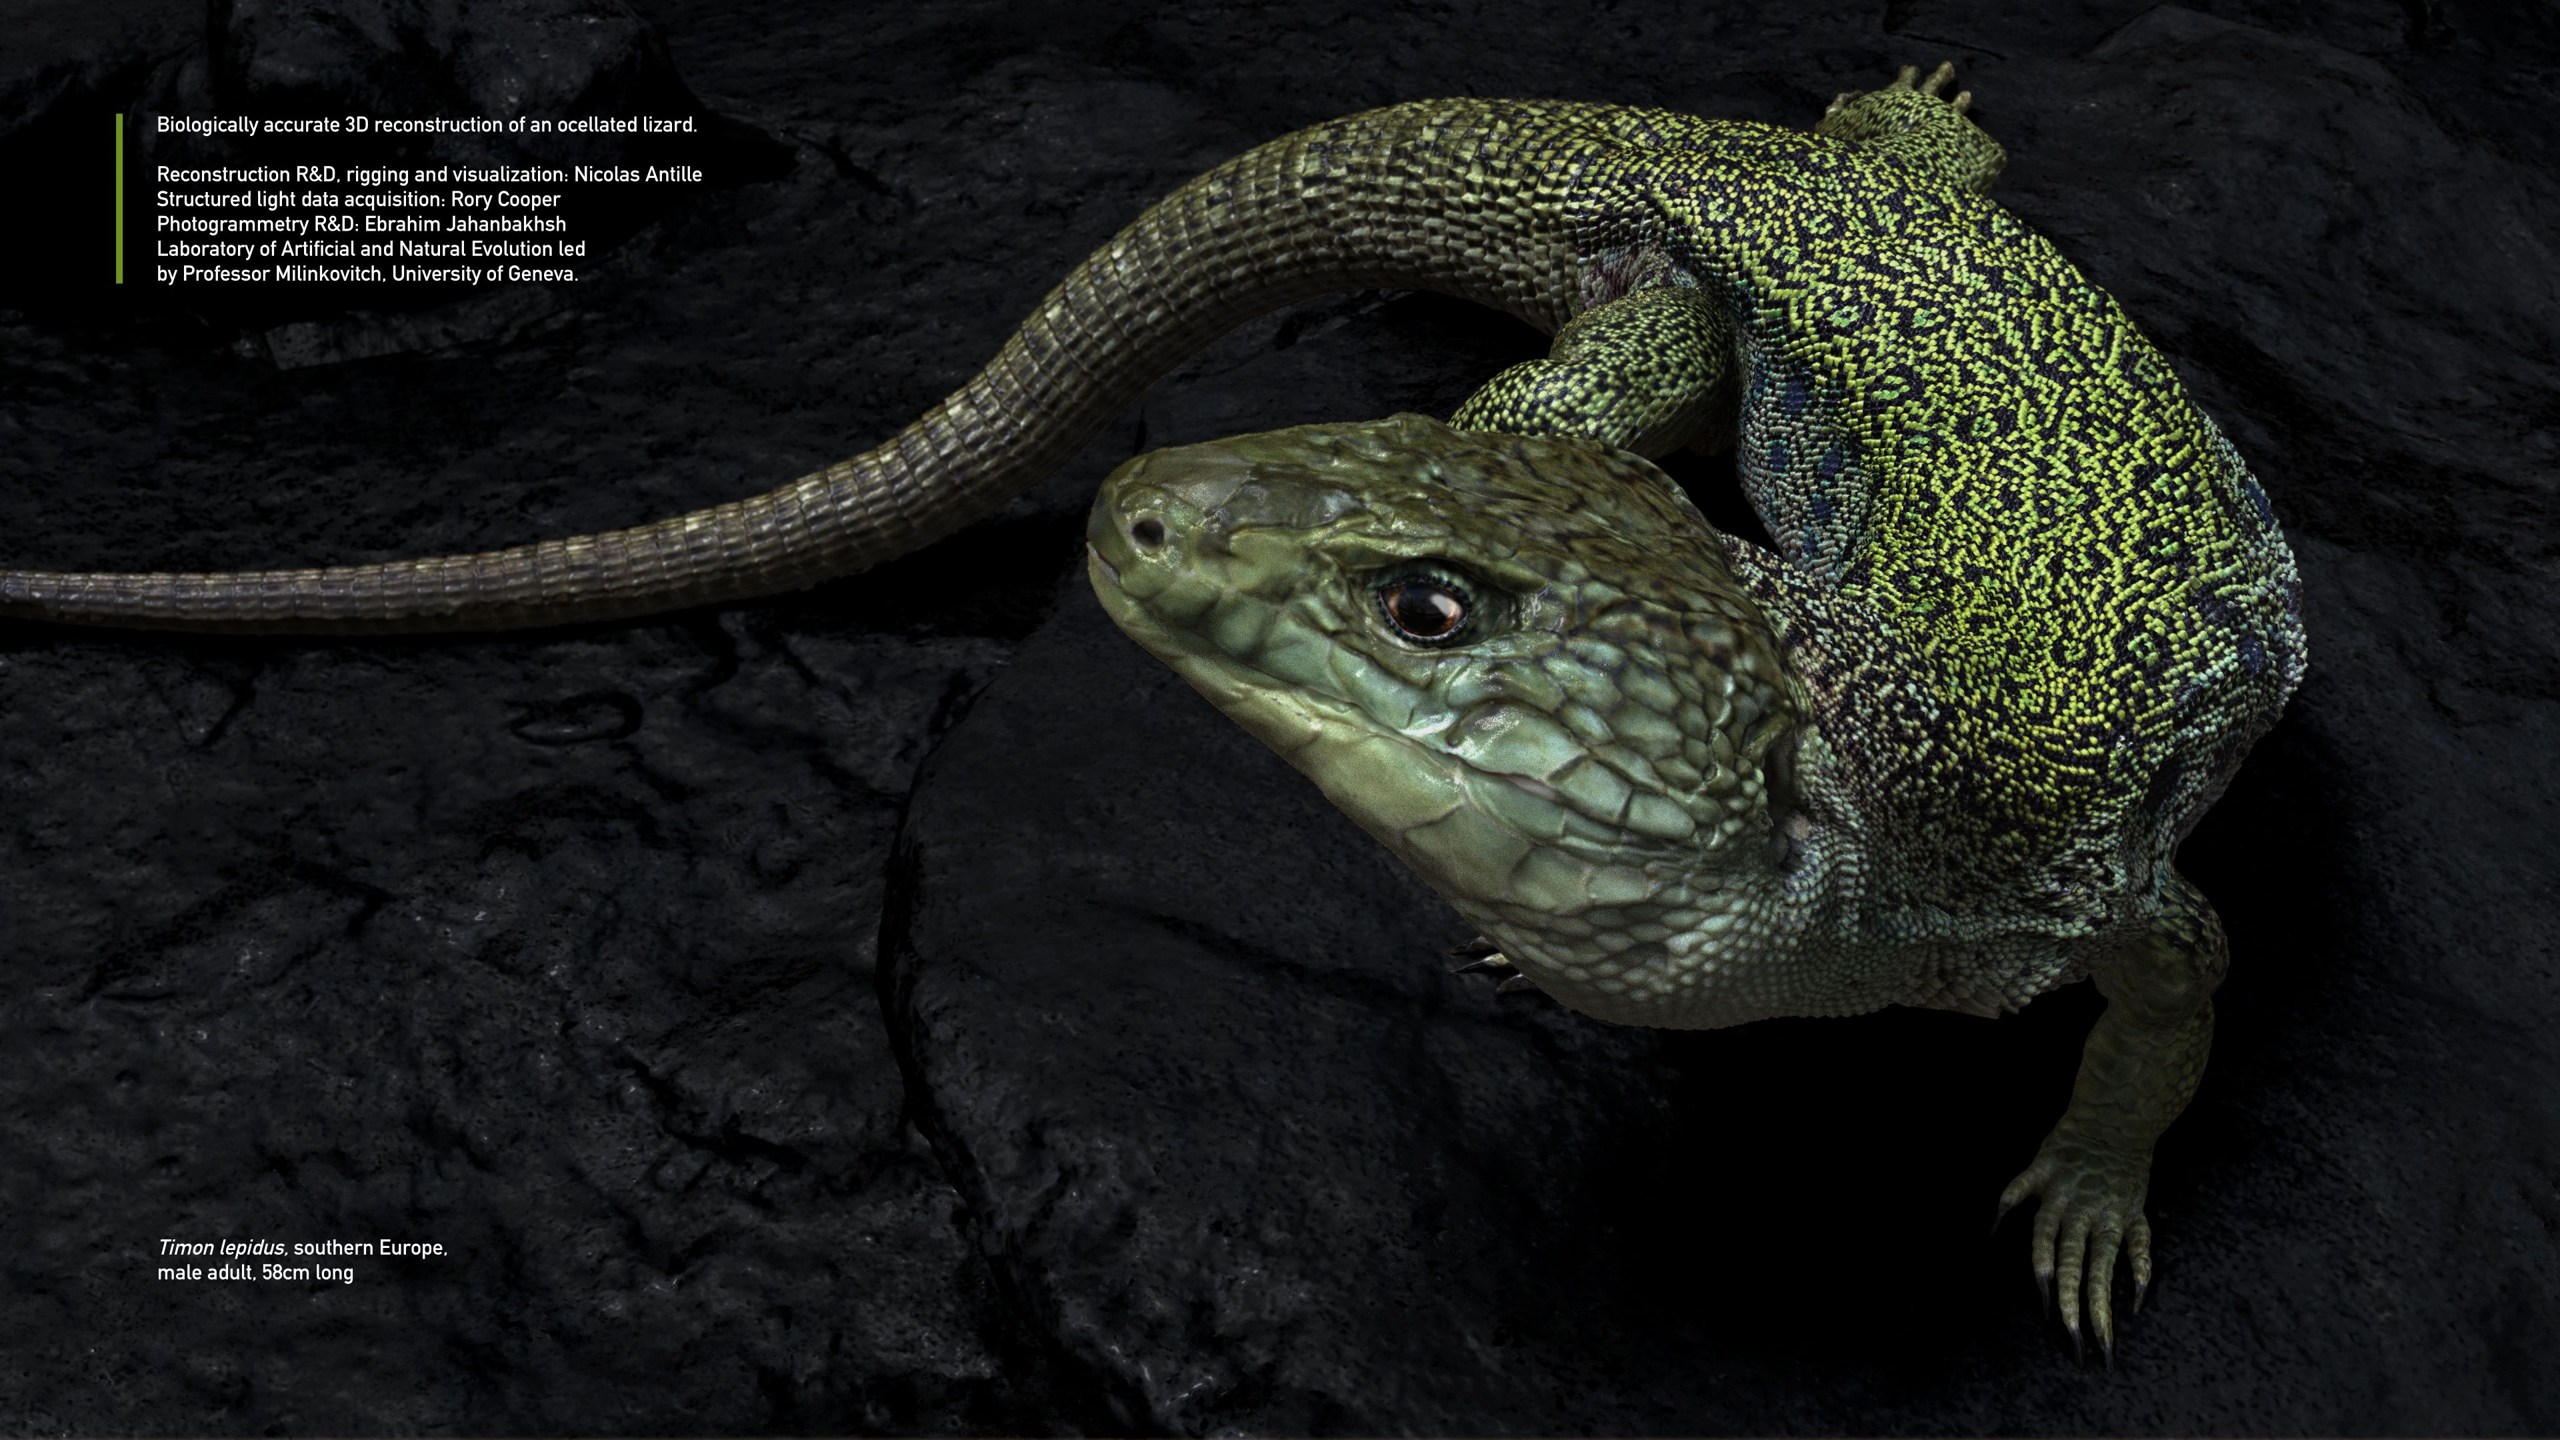
In collaboration with scientists of Laboratory of Natural and Artificial Evolution, University of Geneva, we researched various automated imaging methods for the full reconstruction at high resolution of the skin of a timon lepidus, the largest endemic lizard in Europe. 3D microscopy data cannot be used by photogrammetry reconstruction algorithms due telecentric lenses.
I have developed a semi-automated Python worklow for a full reconstruction by projecting and stitching high frequency details (that are imaged per block) with OpenCV feature-matching and Blender laplacian mesh editing. The resulting reconstruction is rigged and it allows dynamic coloration of skin scales following numerical RD simulations.
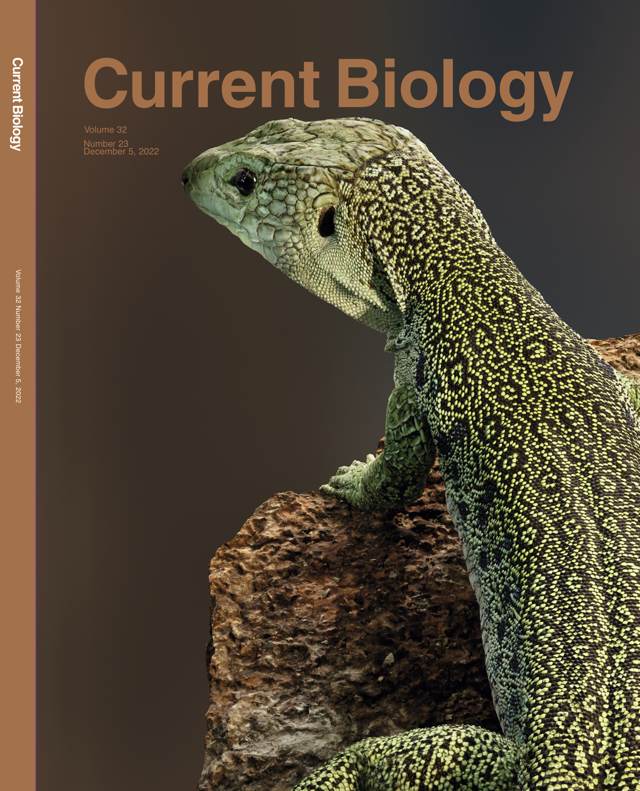 The reconstruction appears on Current Biology vol 32, issue 23.
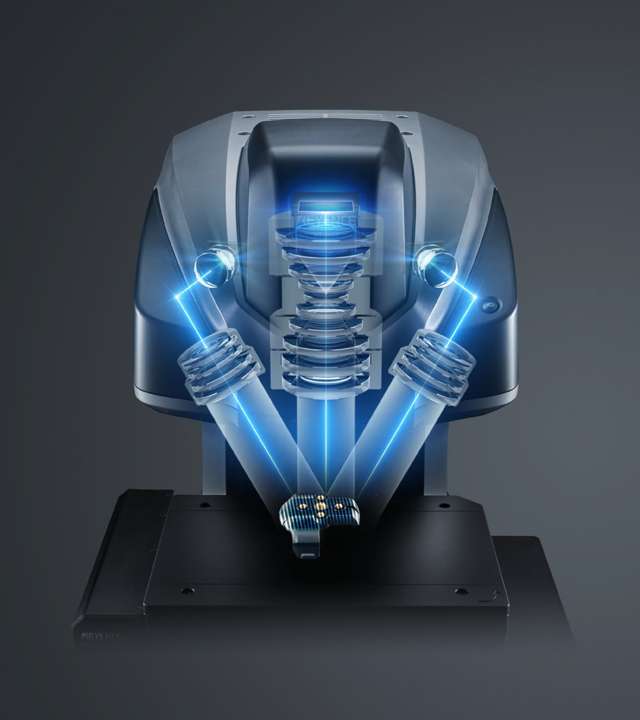
We used a Keyence VR microscope for block-wise structured light imaging
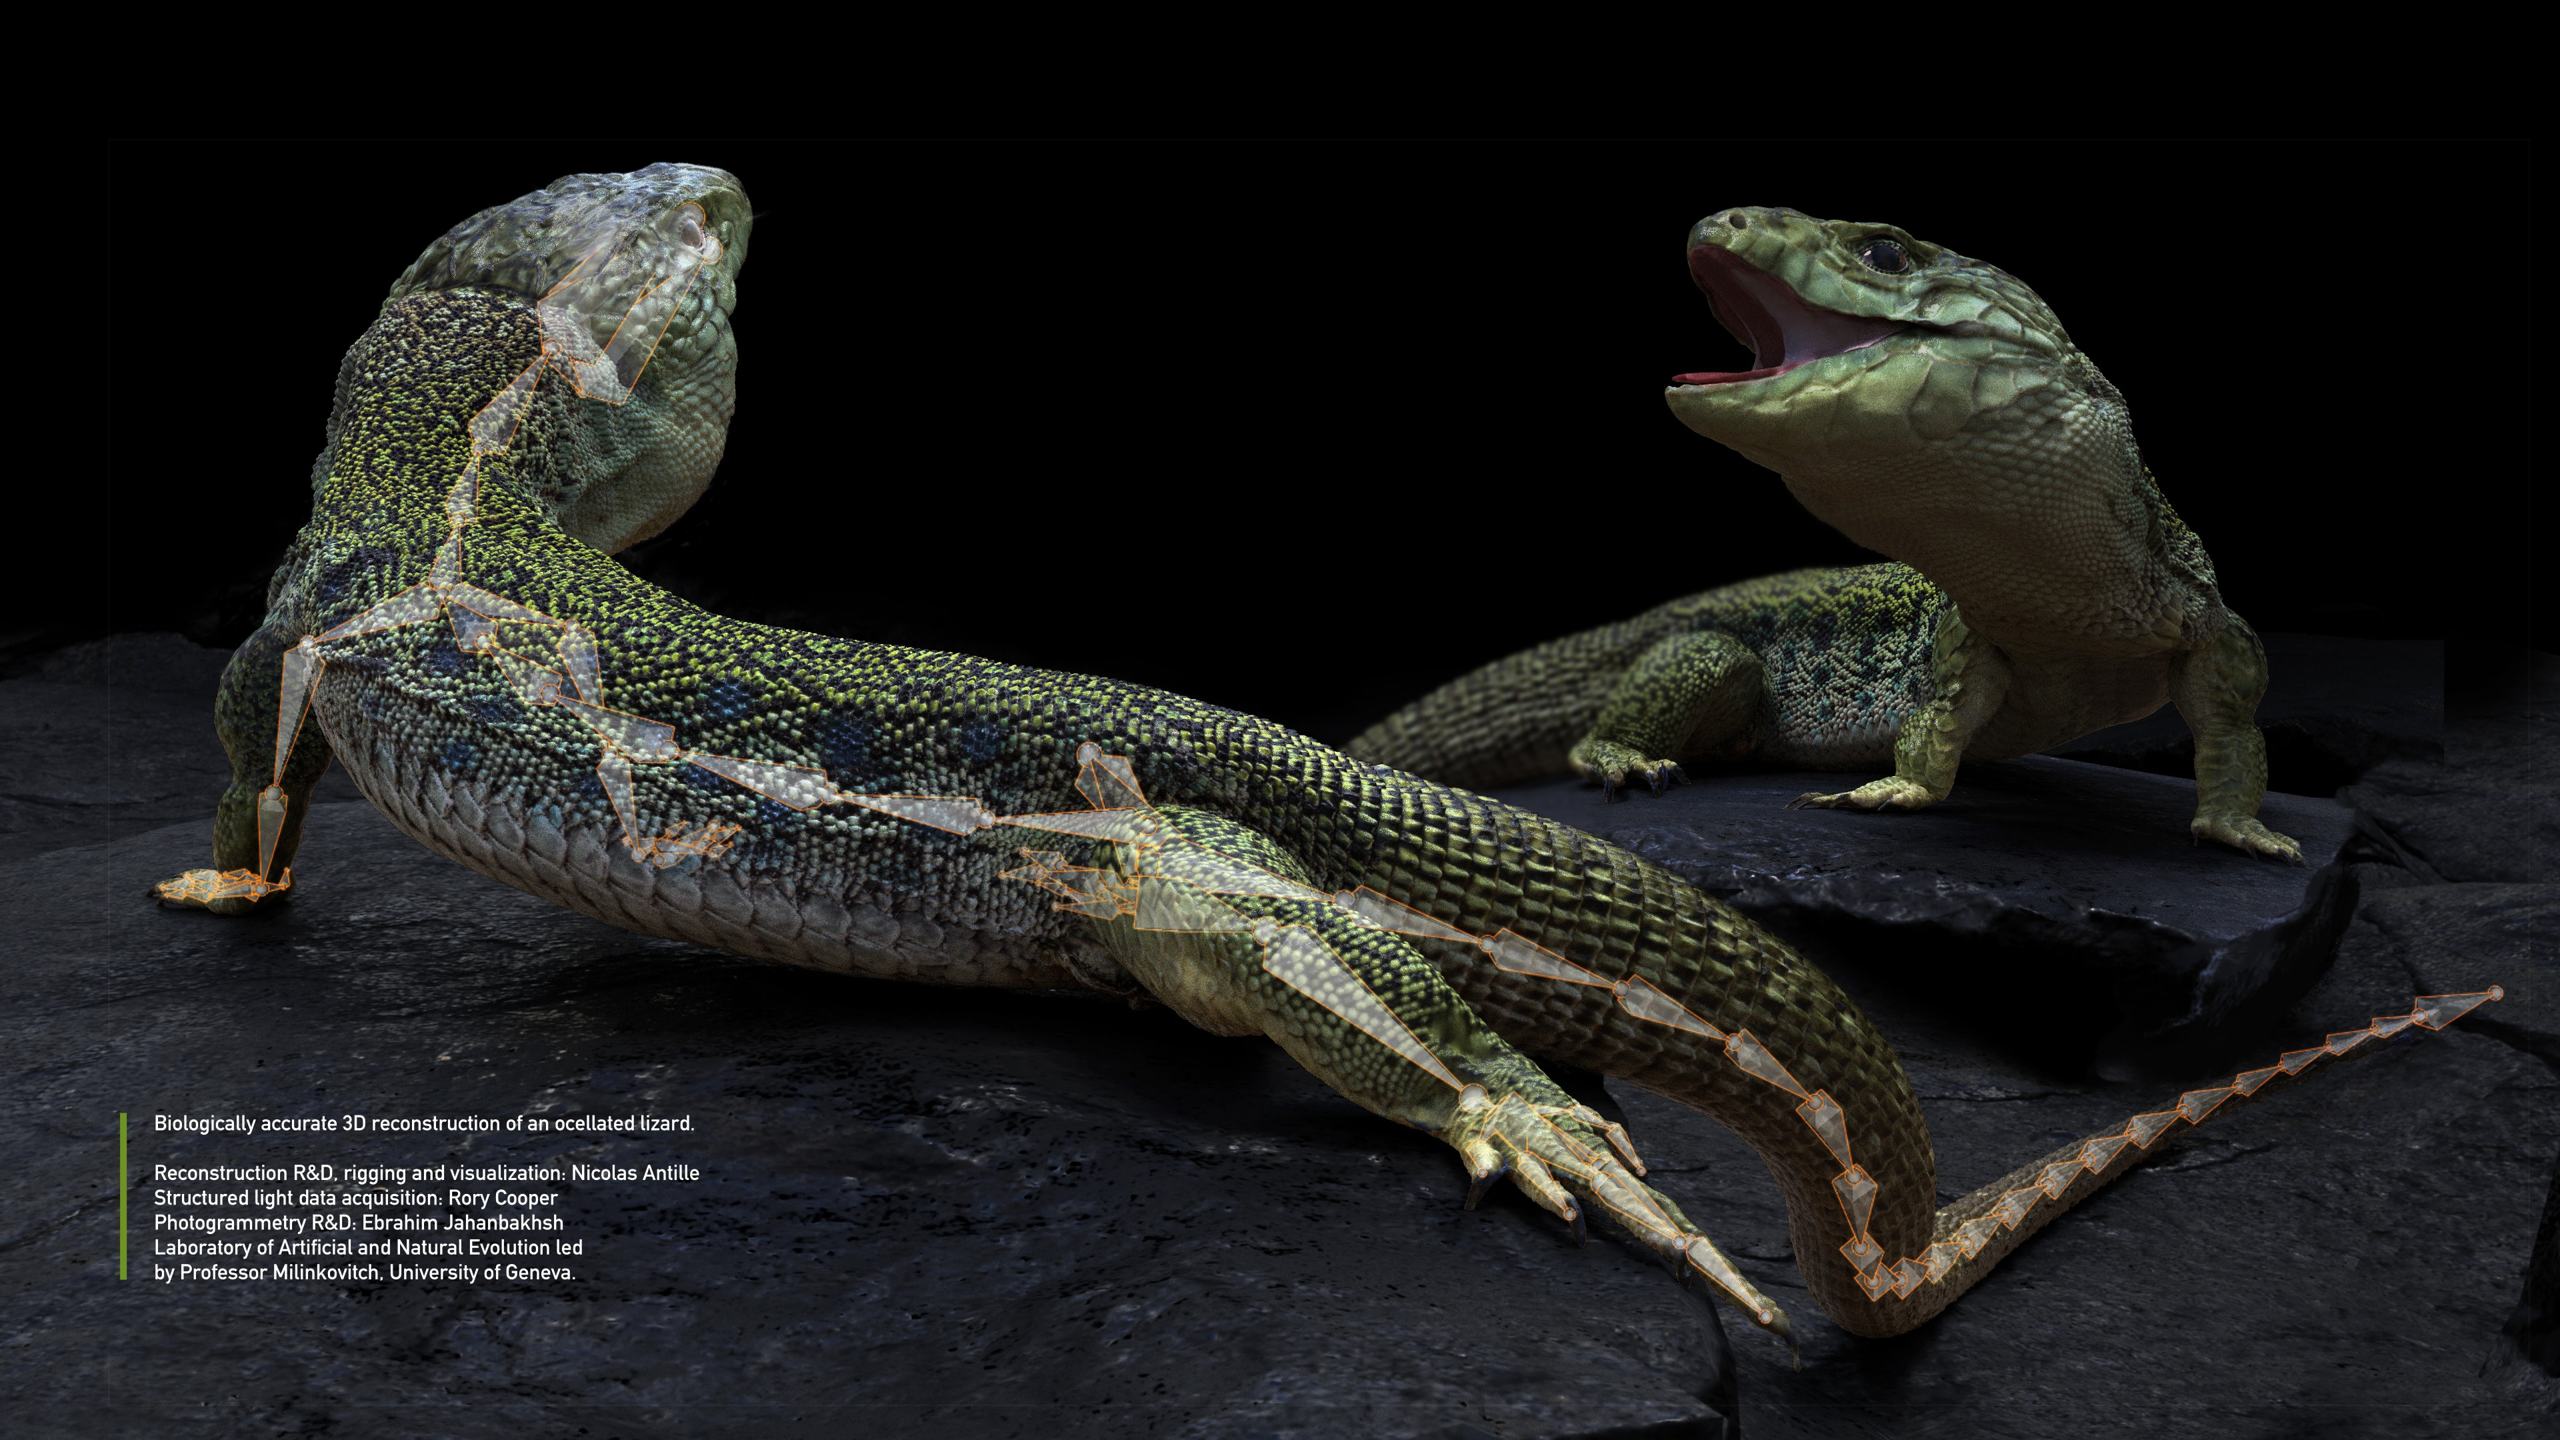
Using improved photometric stereo and structure from motion developed by E. Jahanbakhsh as a canvas, high frequency details from structured light microscopy were projected and stitched together [a difficult part that is my contribution].
Science owners: Szabolcs Zakany, Ebrahim Jahanbakhsh, Rory Cooper, Michel Milinkovitch Related publication: A living mesoscopic cellular automaton made of skin scales, Manukyan et al.
Details of the sub-sampled geometry
Simulations of the evolution of colors
L. Manukyan et al. showed in a Nature publication that the rules that drive the patterns of black and green scales can be inferred with a mathematical model of reaction diffusion of which a cellular automaton behaviour emerges.
A canvas for 3D simulation
This model is down-sampled to keep geometry to a usable level. What matters at this scale is the geometry of the skin scales which impacts next generation 3D reaction-diffusion simulations. This reconstruction is useful for simulating more accurately the evolution of the colors of skin scales and it allows to do research on other parts than the back of the lizard.
Rigging, Mo-cap and presentation in VR
Together with scientist Paule Dagenais, we set up and performed a motion capture of reptiles such as the ocellated lizard. Even with cleaned up data, applying motion capture data directly onto the rigged 3D model requires substantial work. Simulations of discrete reaction-diffusion algorithms can be directly mapped on to the rigged model and I have developed VR prototypes in Unity to show interactive visualization of such data.
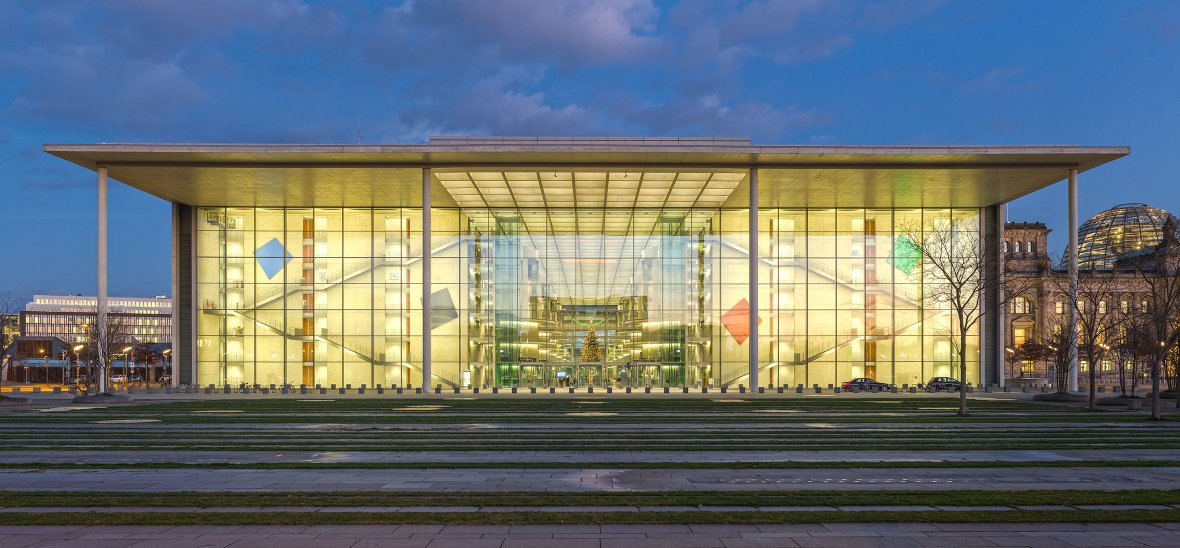
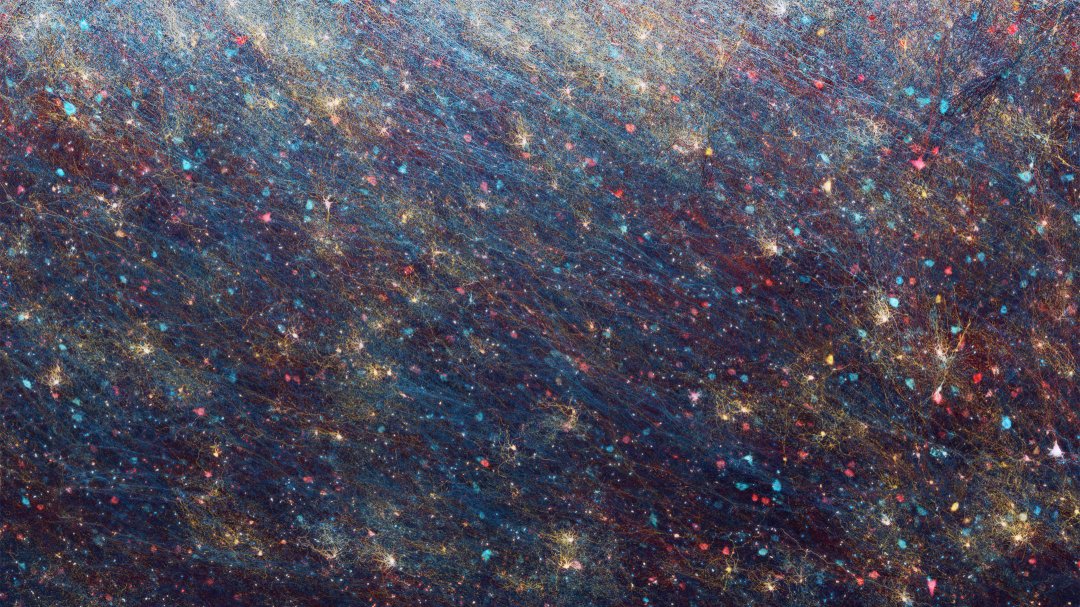
The Fascinating Brain, German National Parliament
R&D to reconstruct a large-scale neuronal circuit and to visualize it alongside a full brain segmentation and connectivity pathways for Ebrains.eu. The resulting murals represent current and future neuroscience and this video shows some details of the largest mural I created.
December 2020 news: the long-running journal Sciences & Avenir published this artwork in issue 886.
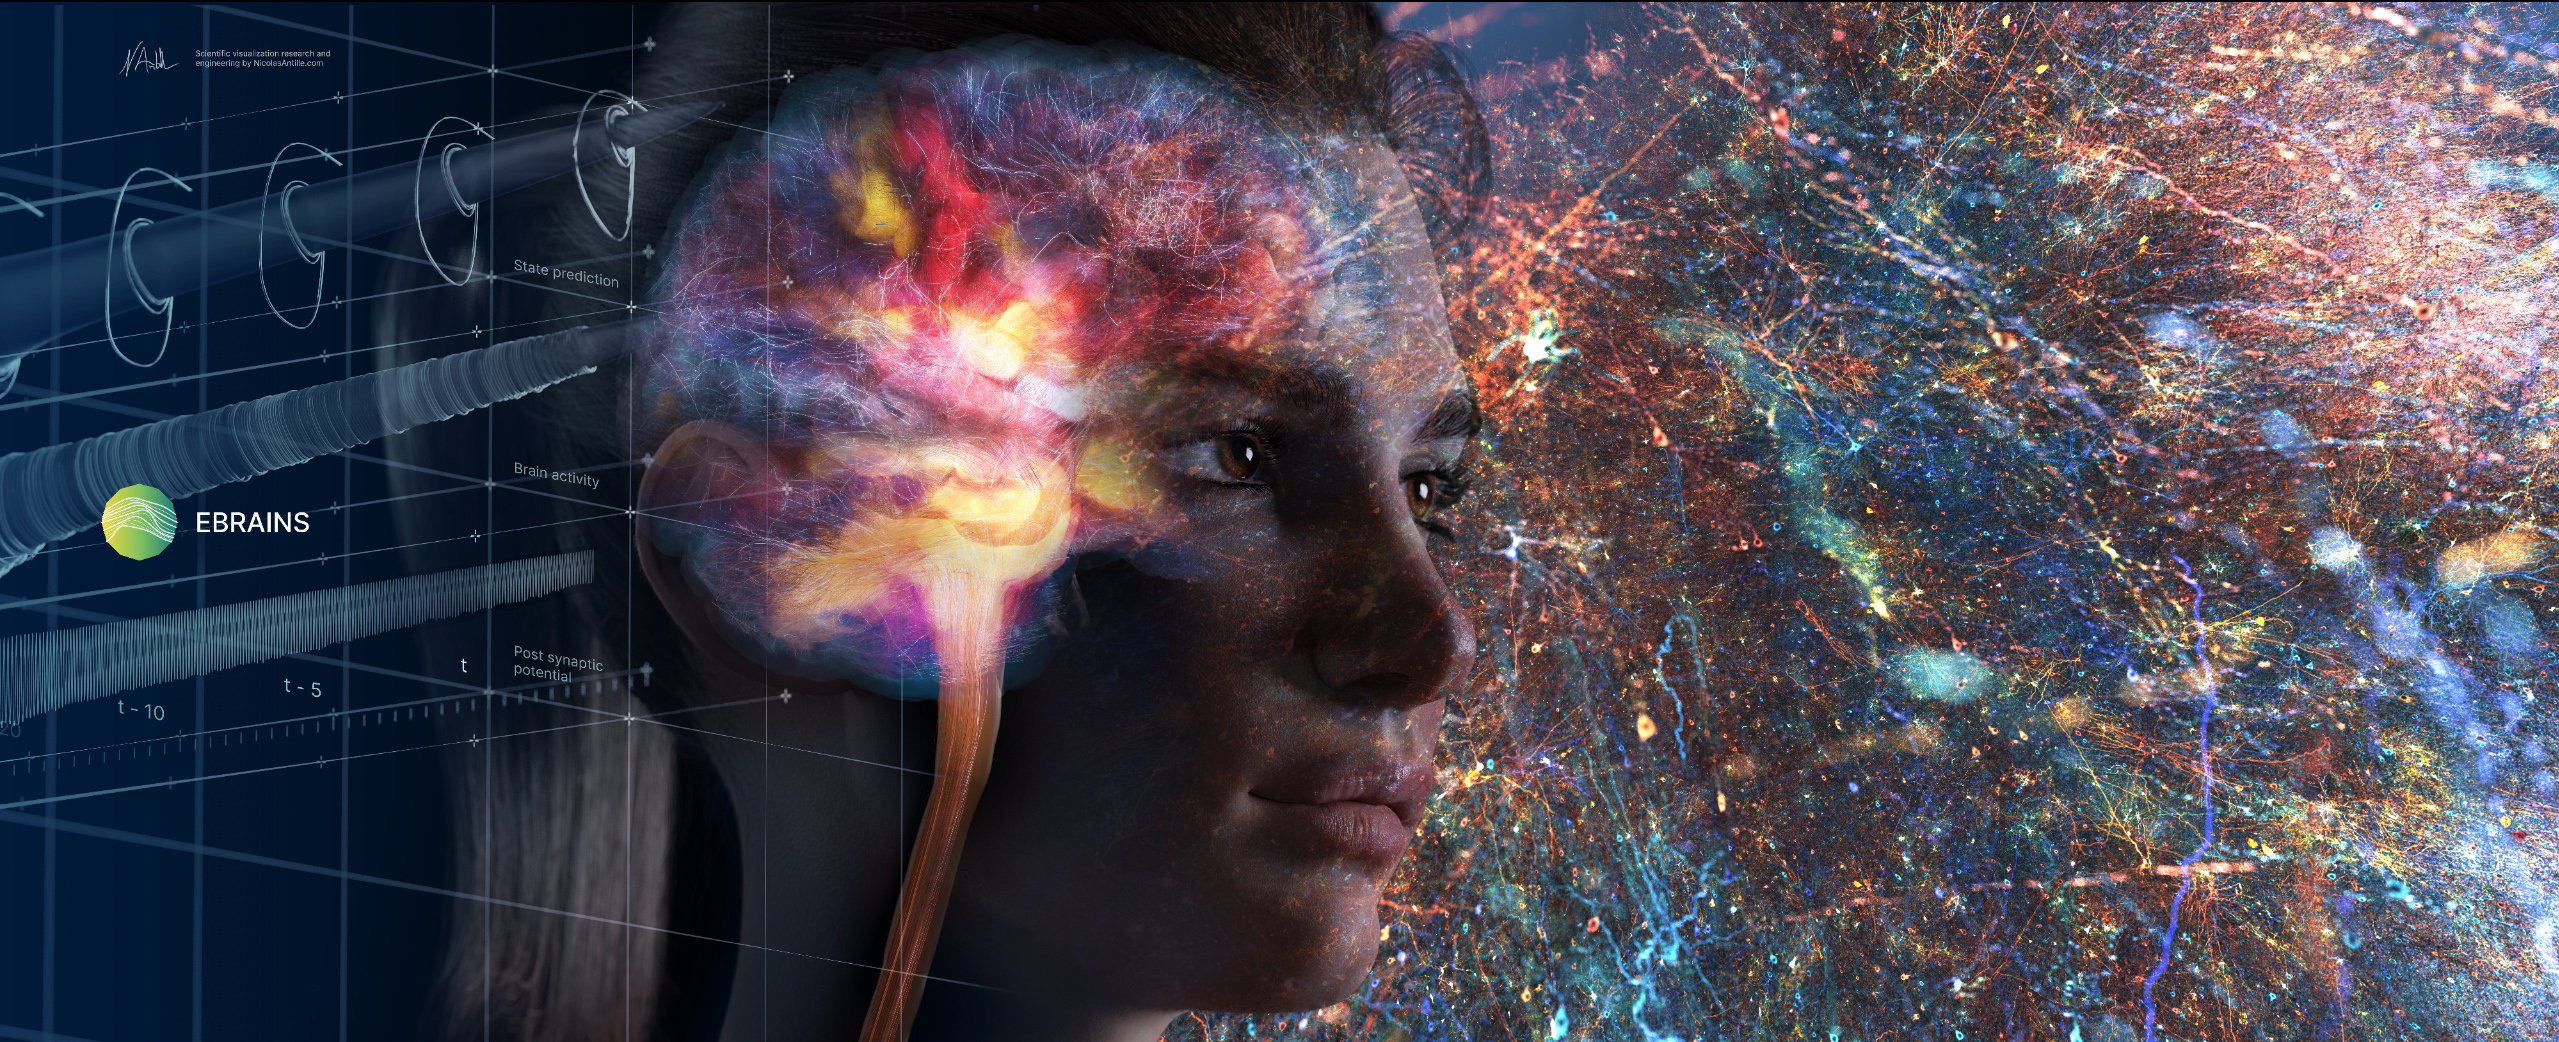
This 6.5 meters long data-driven mural features neuroscientific research at multiple scales, from mathematical analysis of whole brain activity down to cortical activity of millions of cells. This was commissionned for the launch of Ebrains.eu, an European infrastructure project that supports neuroscientific research. The mural artworks I produced were initially presented to the public and to government representatives at the German National Parliament, Berlin.
In this visualization, I reveal multimodal data of The Virtual Brain with functional pathways in the human brain alongside a view over a ridge of the temporal lobe with millions of human neurons. This is the future of neuroscience that many neuroscientists and engineers are building. This fresco represents a woman on purpose with the hope that more of them will lead neuroscientific research.
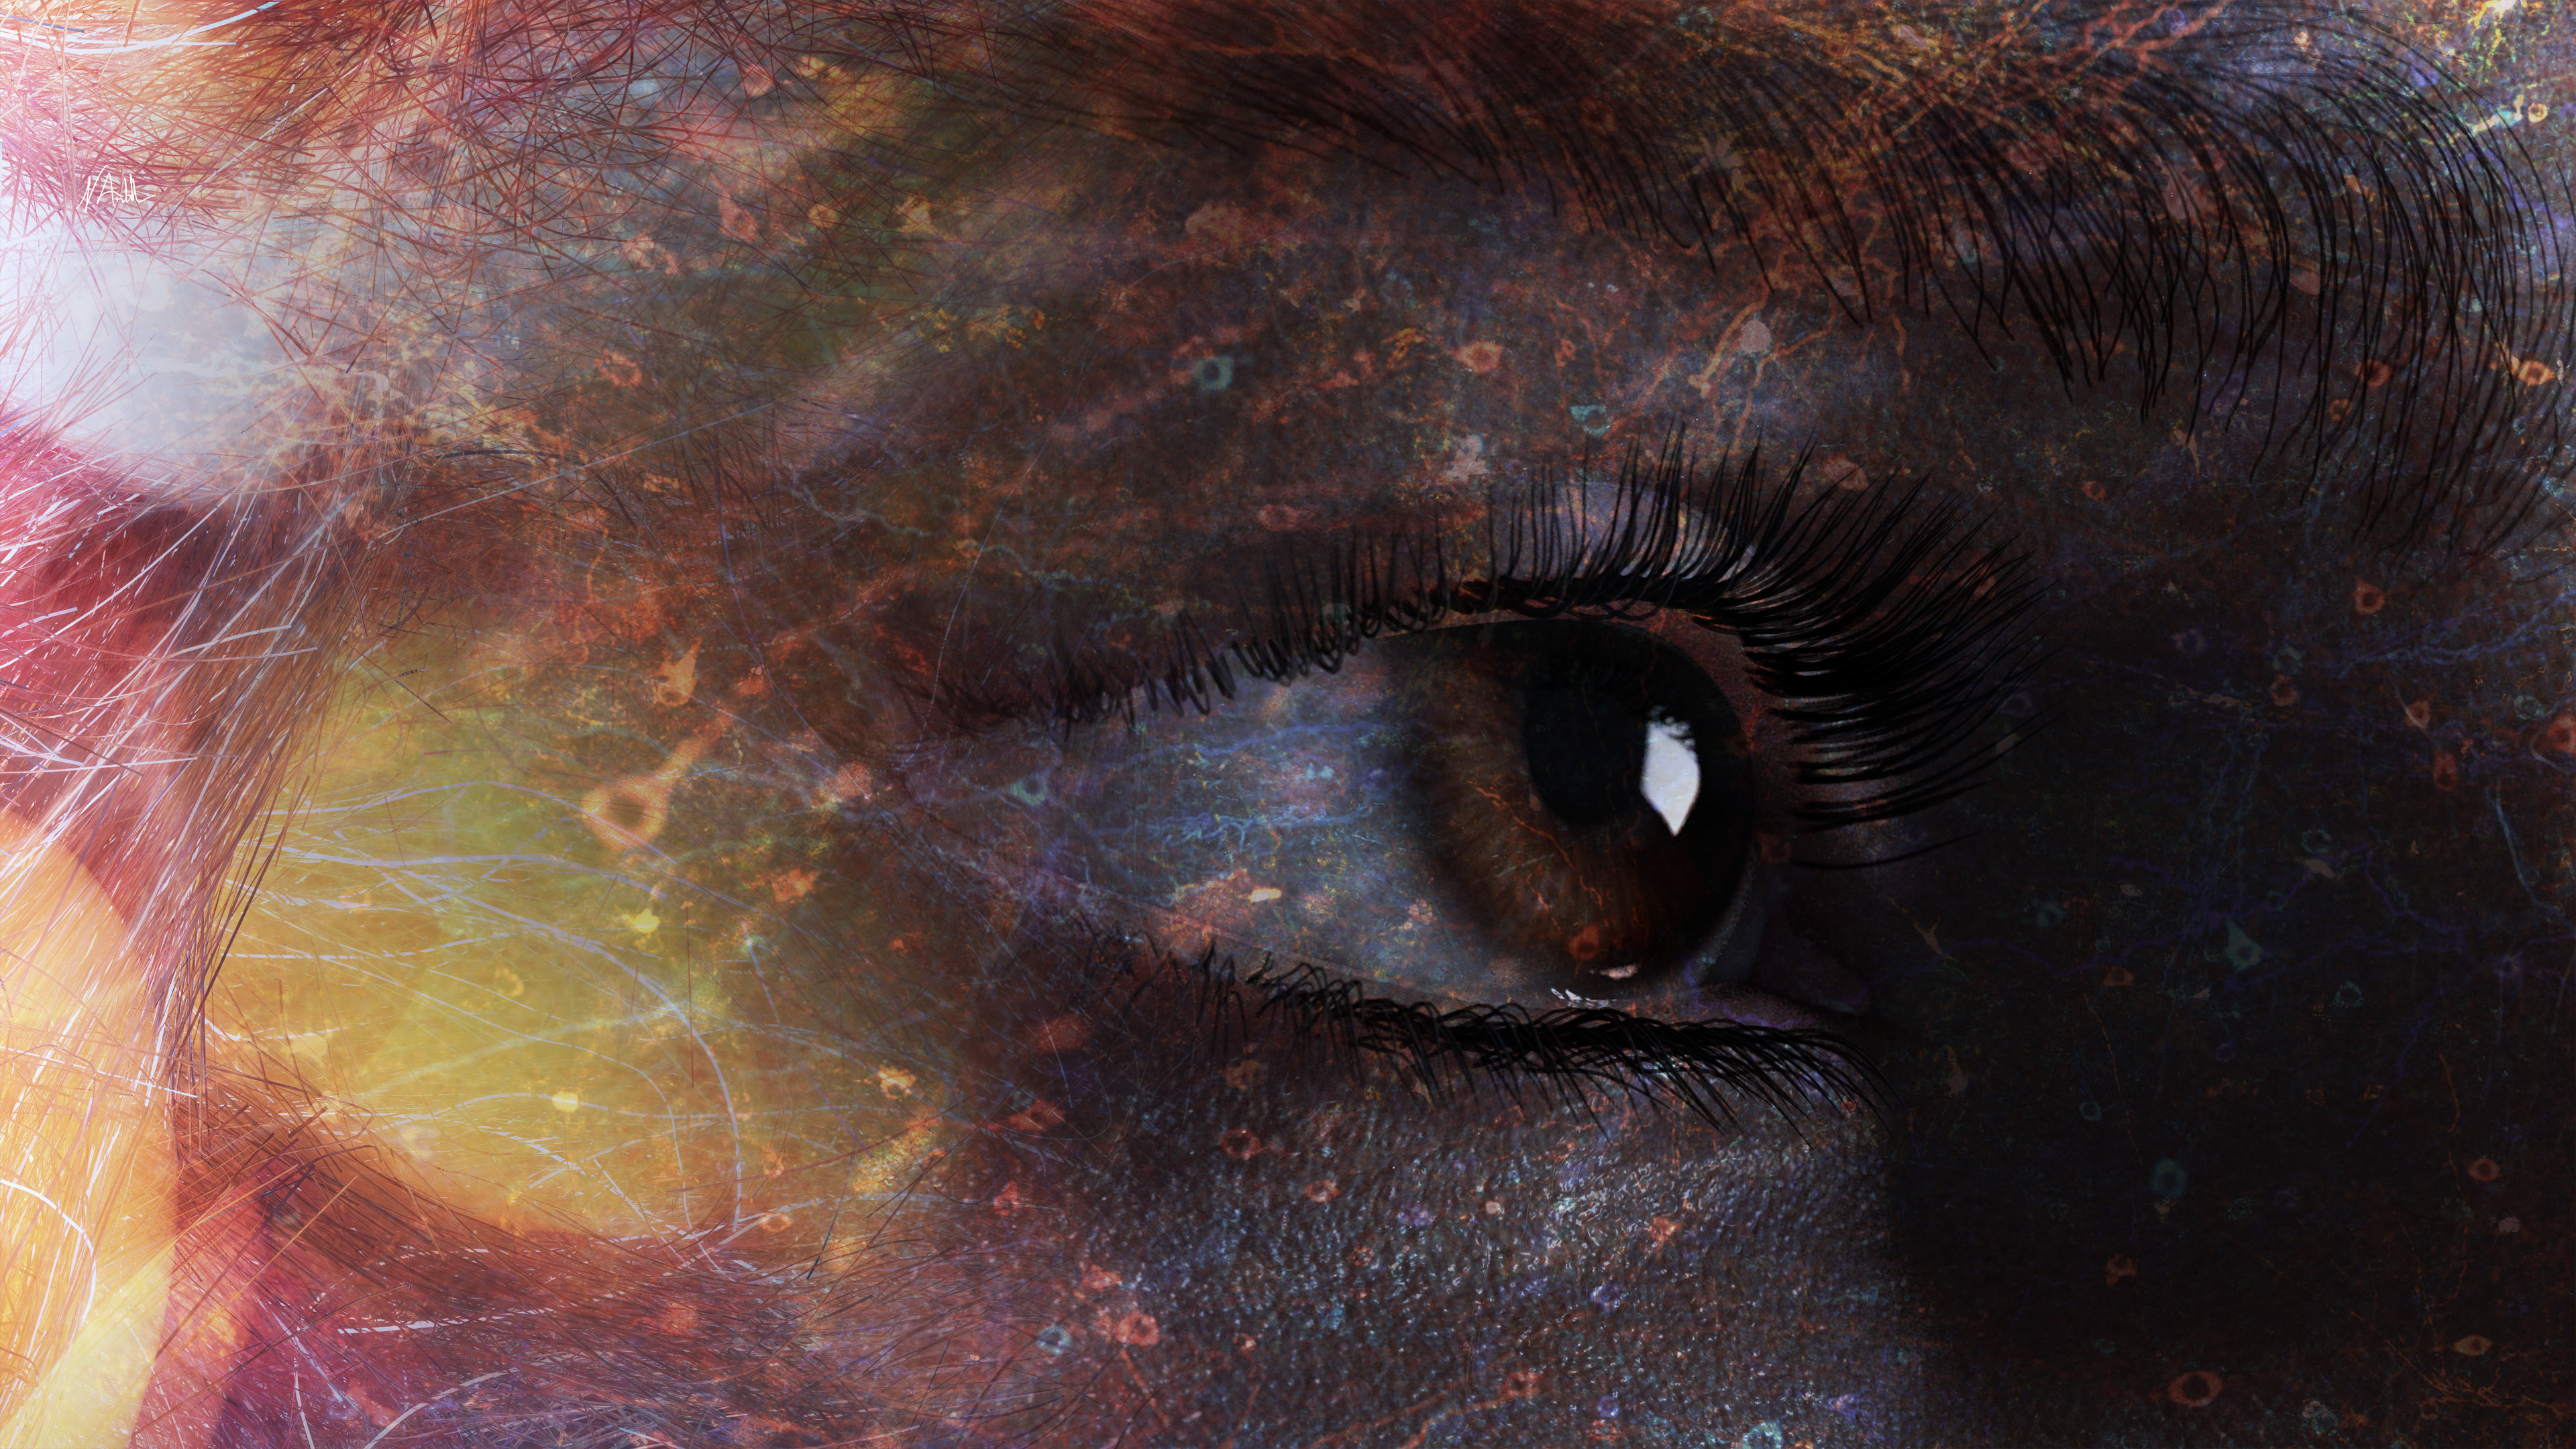
Reconstruction of the first large-scale digital circuit of human neurons in the temporal lobe.
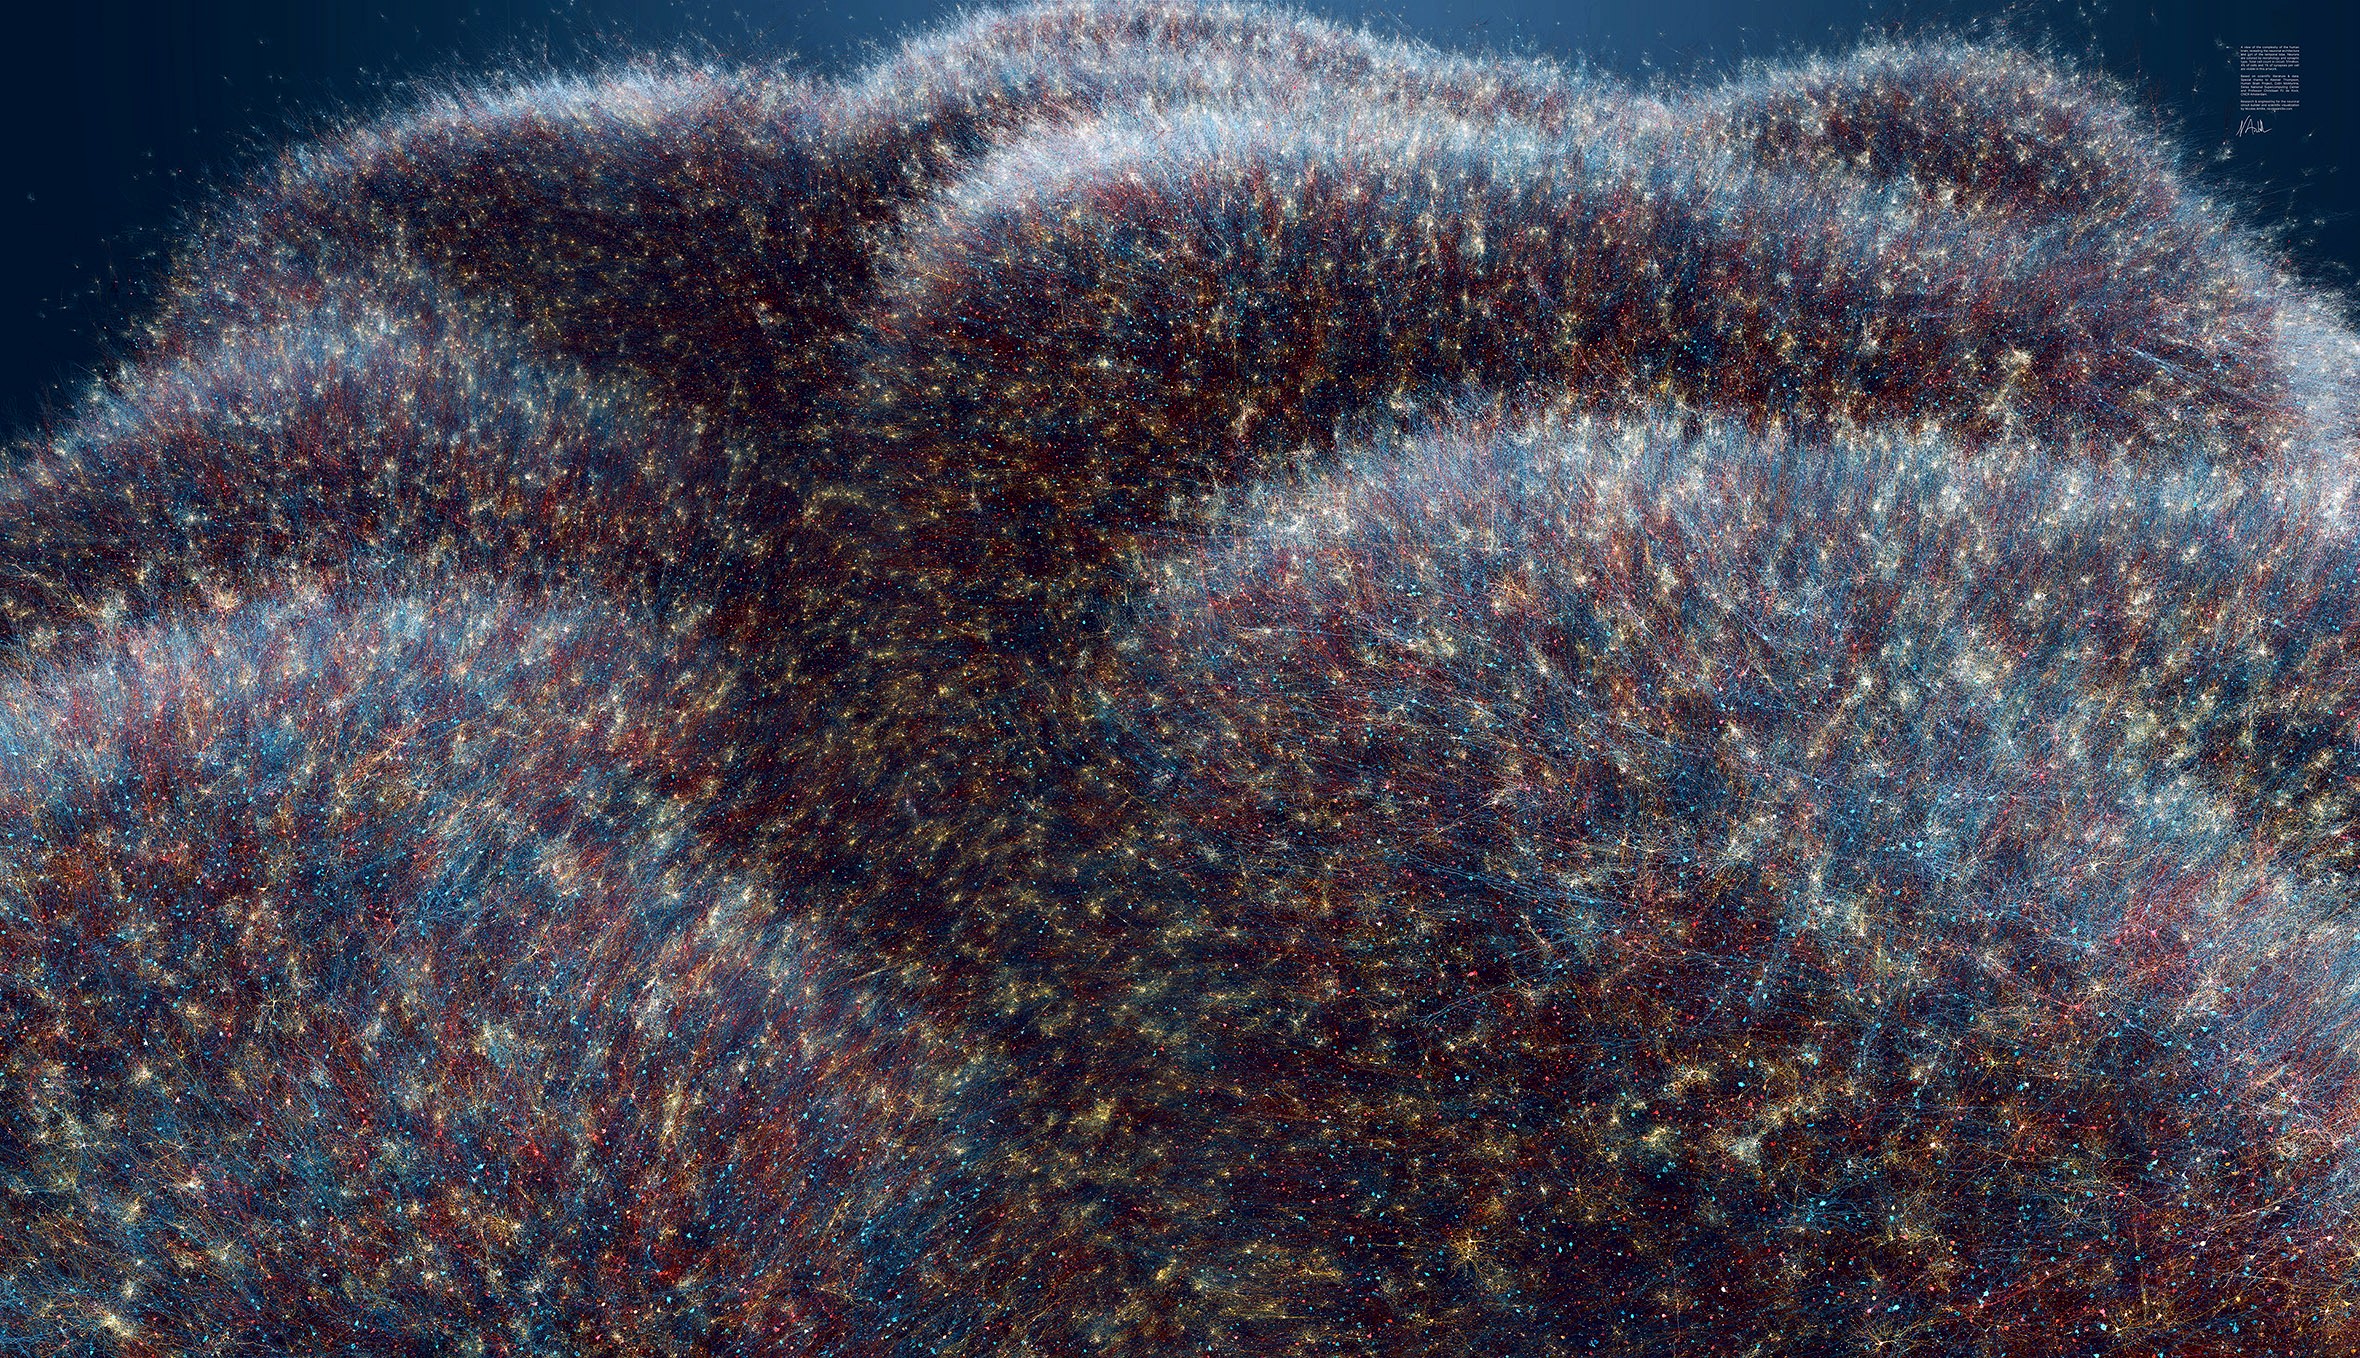
A view on the neural architecture of the temporal lobe within our brain
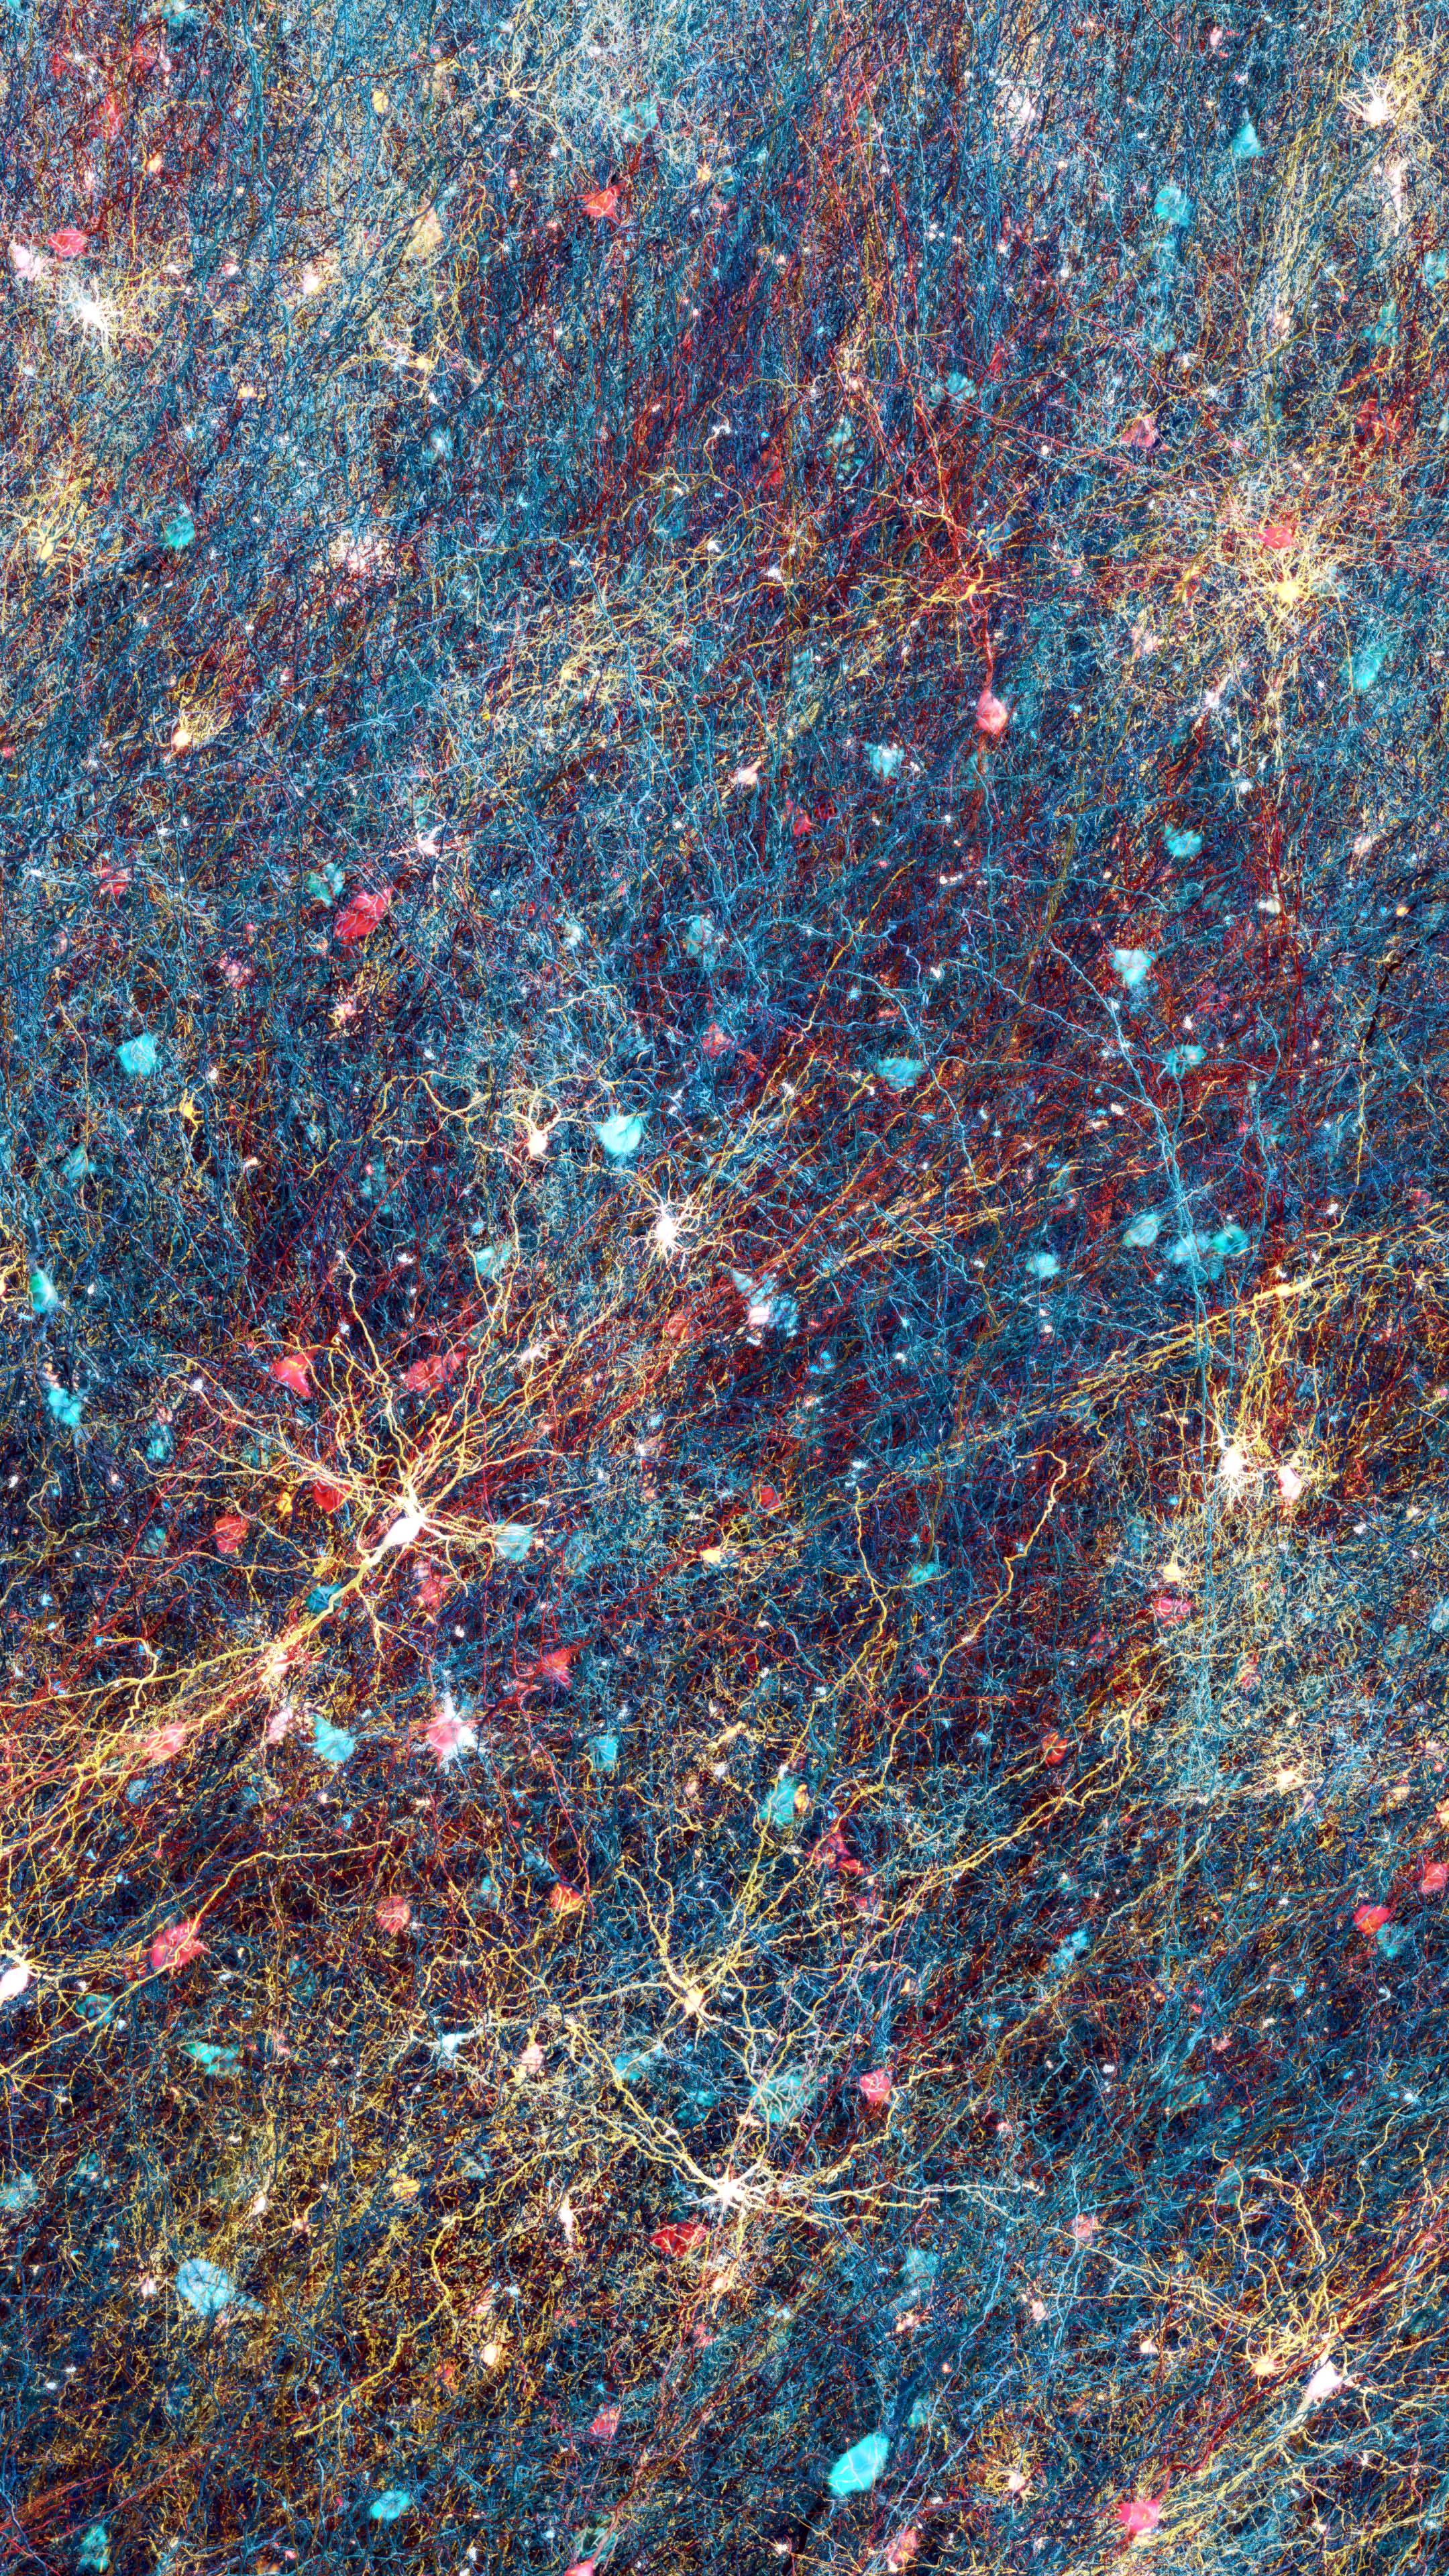
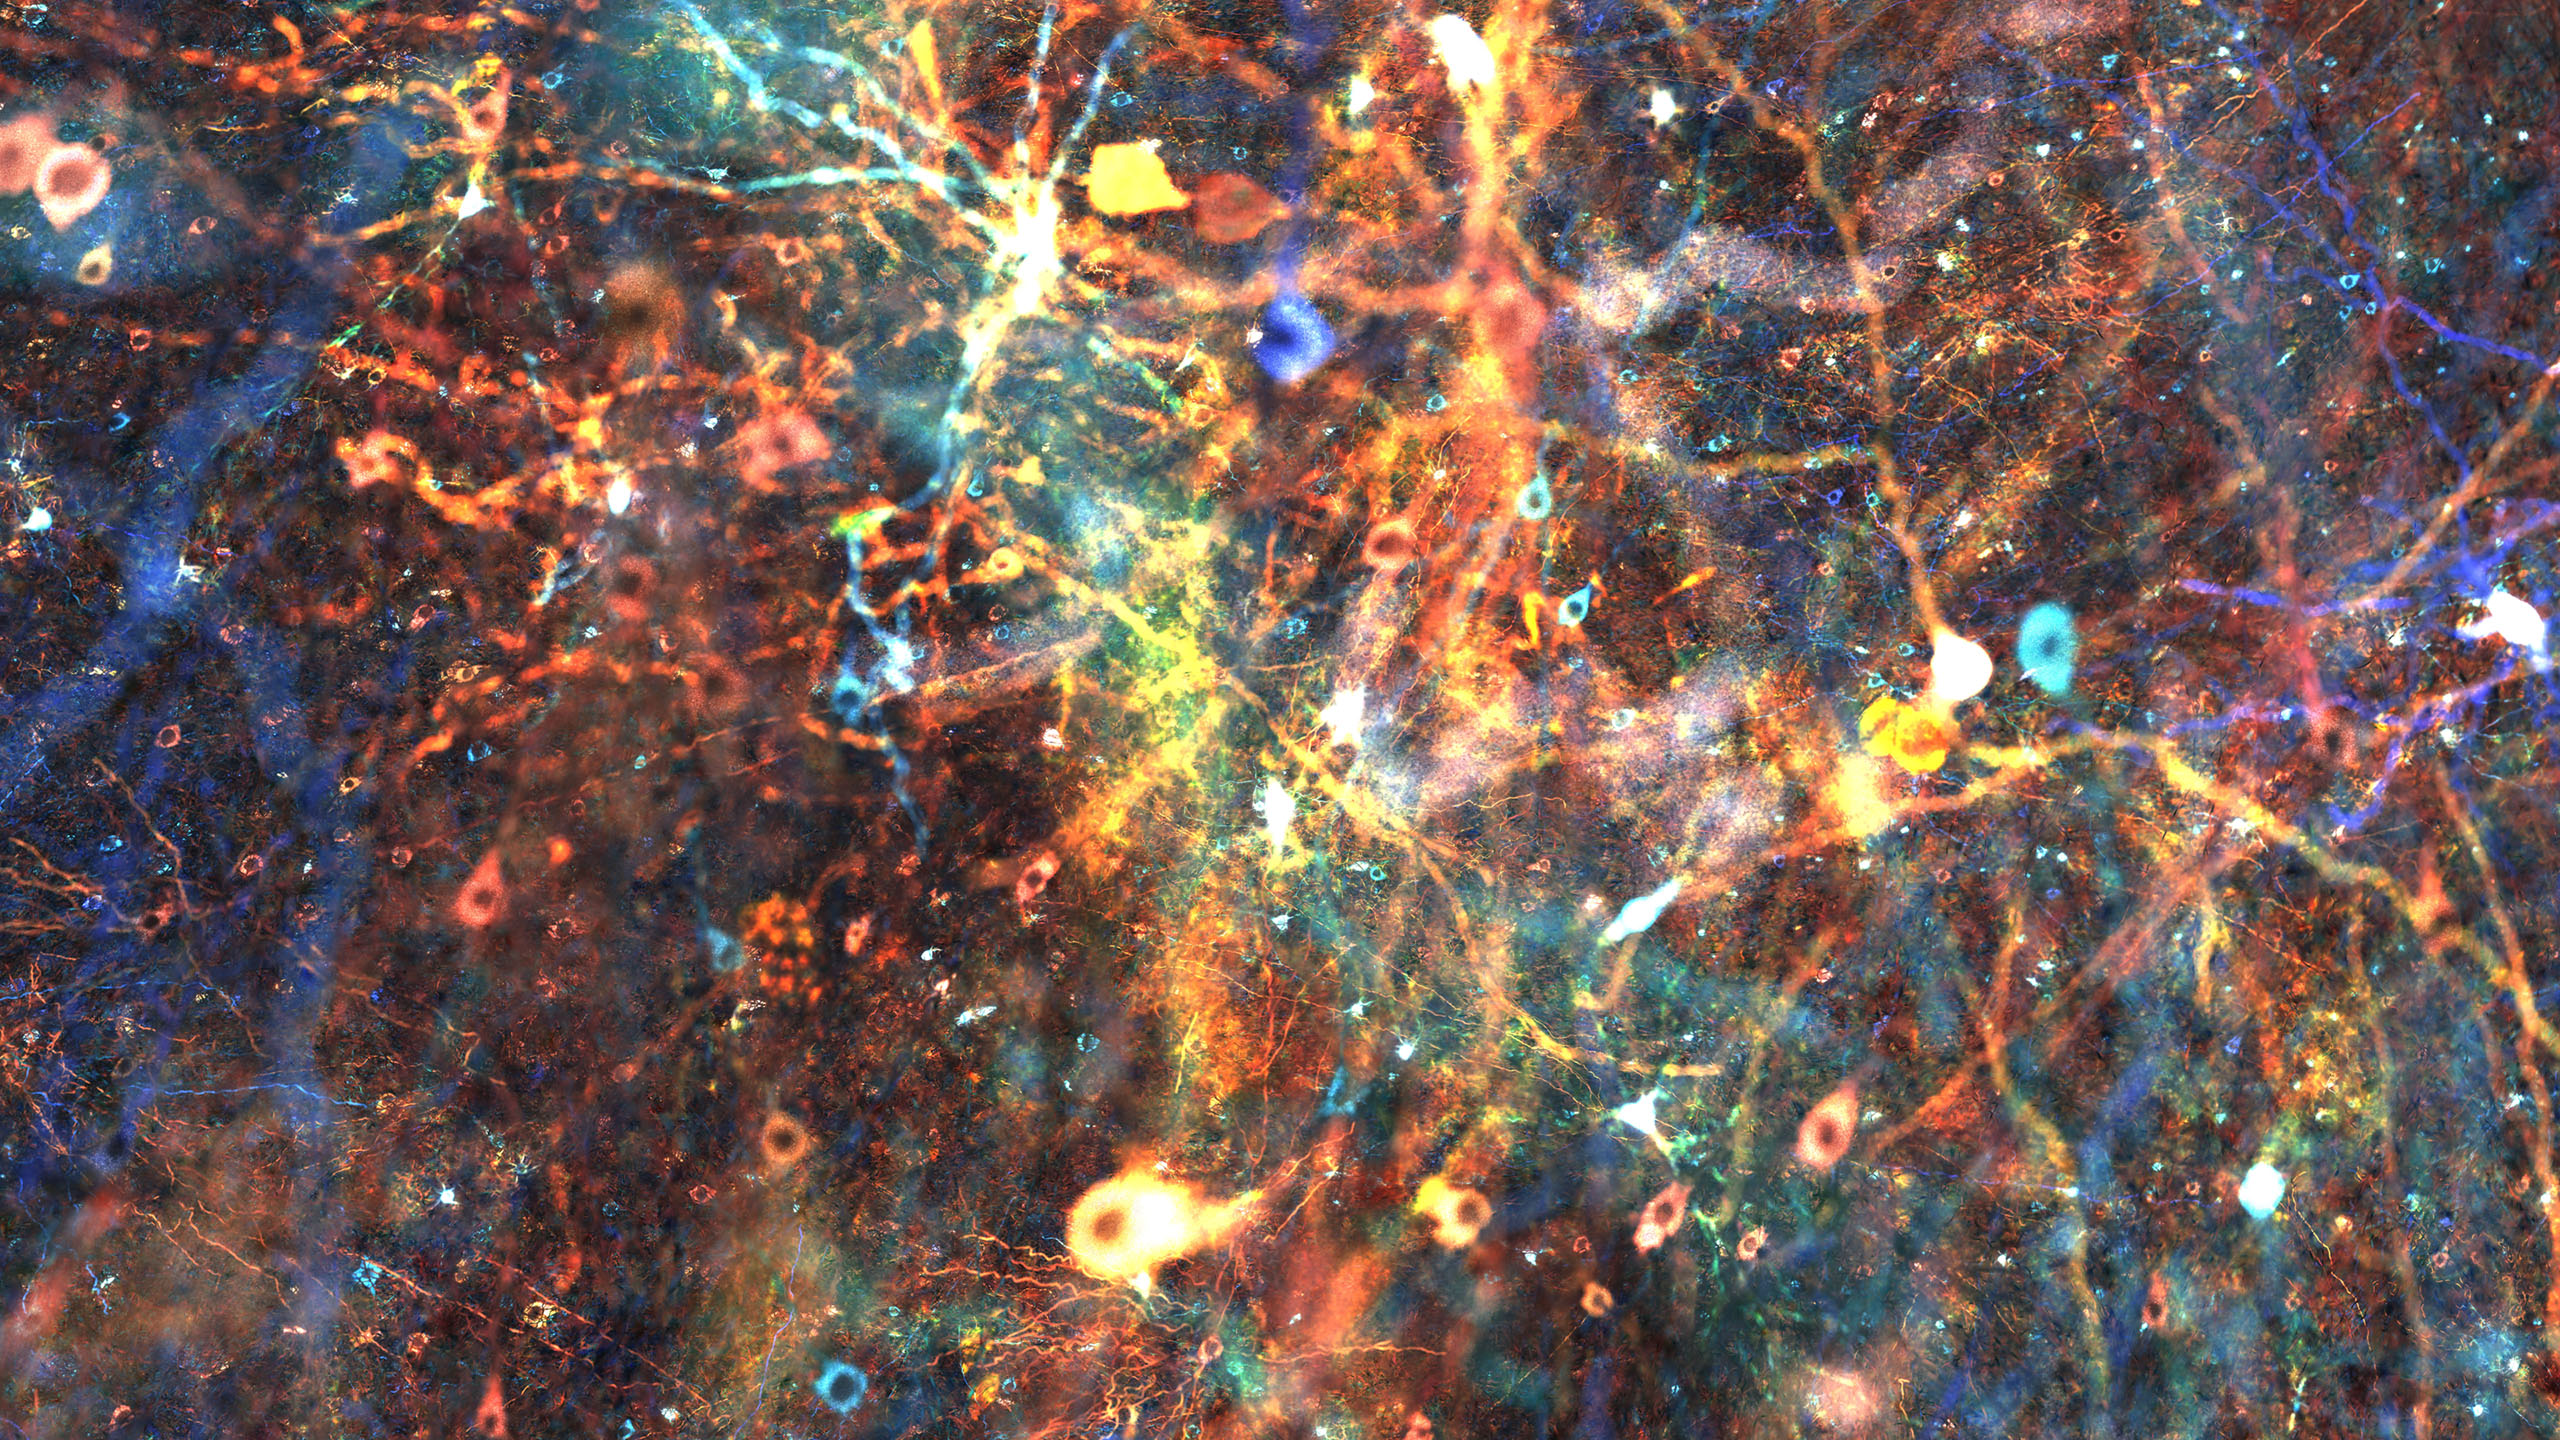
Here's a detail of the mural artwork at full size in a bright region. Spines are visible at this scale. A tiny fraction of the actual amount of synapses is represented here with 1% of spines per cell.
This mural artwork is the first digital reconstruction of human grey matter of the temporal lobe. White matter is hidden below this mountains of cells. Colors reveal structural properties of the circuit such as layers, cell morphology type and synaptic class. Full mural artwork size: 47000*27000px, 4m by 2.2m at 300dpi.
5% of neurons are visualised from a circuit of 50 million cells. The system looks so complex that we can hardly distinguish spines – at a very low density per cell here due to memory limit. Neither glia nor vasculature are in this model. Cell nuclei are visible but there are no other organelles here.
For this mural, I reviewed scientific literature, I curated data and I researched and developed two new tools. The first one is a curvature-dependent neuronal circuit builder that handles non trivial placement of neurons. The second one is a new 3D reconstruction tool made for Blender 2.8 that leverages my C++ mod of Blender/Cycles for large-scale visualization of splines, which I used for both murals visible here.
About these scientific visualizations
Several mural artworks were commissionned by the Human Brain Project and were revealed at Bundestag German parliament, Paul-Löbe-Haus, Berlin on the 27th of November until December 19th, 2019. After that, the exhibition moved to the state parliament of Northrhine-Westfalia in Düsseldorf from January 21st to 31st, 2020. Later the exhibition moved to Oslo, Norway from September 16 to 28th 2020, an event organized by the faculties of Medicine and Life Science, University of Oslo.
Scientific data provenance: CNCR Amsterdam, Neuromorpho.org, Institut de Neurosciences de Marseilles, Charité University Berlin and Human Brain Project.
For the production of the murals, I engineered software solutions with Python and C++ on top of Blender with my custom modification for large-scale graph visualization. This was deployed with Docker onto a Cray supercomputer at CSCS Lugano.
The images I produced were used for Ebrains communication such as on ebrains.eu and on a VR booth at FENS Virtual Forum 2020.
Special thanks to
Human Brain Project
Alastair ThompsonChristian Fauteux
Annapaola Santarsiero
CNCR Amsterdam, Netherlands
Christiaan PJ de KockMohan et al
CSCS supercomputing center
Colin McMurtrie
Charité University Berlin
Petra RitterJessica Palmer
Paul Triebkorn
Institut de Neurosciences de Marseille
Viktor JirsaMarmaduke Woodman
Lisa Otten
Another detail of the mural artwork at full size, this time in a dark region. Nuclei (within somata) and spines on branches are more visible in this case.
The following artworks are some of my contributions to Blue Brain Project / EPFL at Campus Biotech from 2014 to 2019.
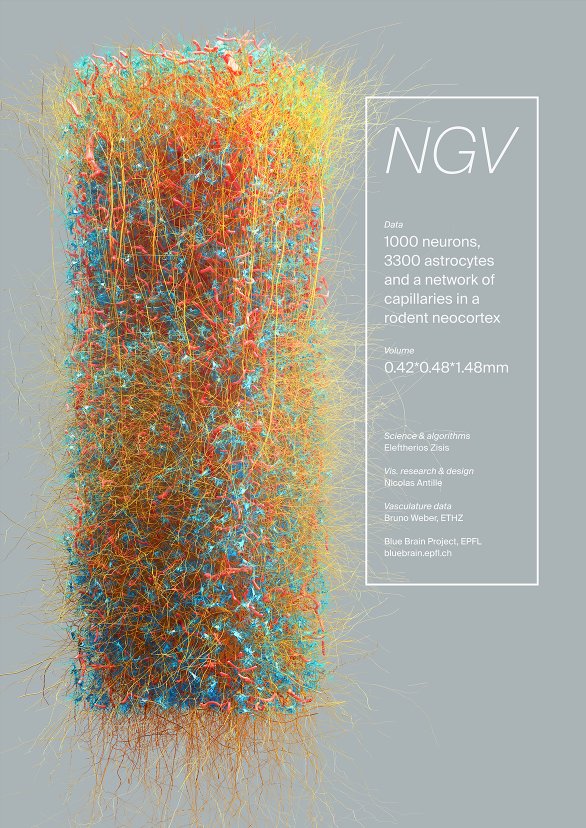
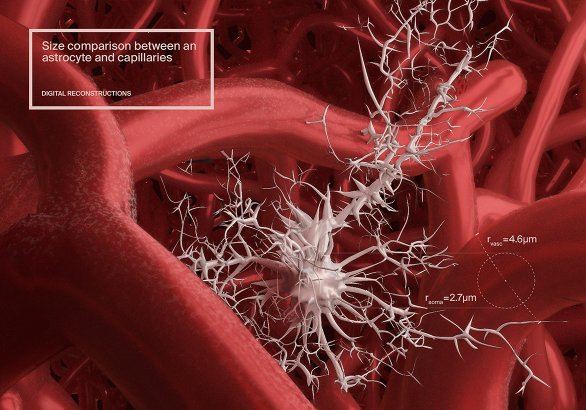
The Neuro-Glia-Vascular ensemble
This visualization is part of the engineering research I did as part of a long term collaboration with scientist Eleftherios Zisis to reveal his research on the reconstruction of a digital circuit of neurons, astrocytes and blood vessels.
In the brain, neurons are supported and regulated by other types of cells known as the glia. Among the glia, astrocytes are territorial cells – shown here in blue – that, among other complex interactions with their surroundings, take nutrients from the blood vessels in red and distribute them to neurons in yellow. But astrocytes do more than that. For instance, they support a part of the synaptic activity within their domain. This visualization shows neocortical grey matter roughly 1.5mm tall and 0.5mm wide.
Tools
Custom Python library for meshing and visualization, Blender, Cycles raytracer modification.Science owner
Eleftherios ZisisPublications
- Portal contemporary art exhibition in London
- Le grand Atlas du cerveau (2018). Glénat Livres.
Neuronal connectivity patterns
Looking at digital simulations of neuronal activity, scientists found connectivity patterns: neurons seem to have a preference to connect with a chosen set of neurons and the resulting connectivity forms patterns like the "rich club" in the middle of this image or the feed-forward vertical pattern. The emergence of a communication pattern among cells reveals a functional structure within what appears to us as a chaotic forest of cells.
Publication
Nature Neuroscience TOC, July 17Tools
Blender, Sverchok, Cycles.Science owner
Eyal GalCellular variety in a 1mm^3 neocortical brain tissue
This artwork illustrates data obtained with electron microscopes of a small brain tissue.
A variety of cells are visible here, from microglia in blue/turquoise to neurons in purple, astrocytes in orange-yellow with a perivascular process and also myelinated axons in dark blue and blood vessels, here not reconstructed as endothelial cells, which shows the limits of the reconstruction.
The 3D models except red blood cells were automatically reconstructed from EM stacks by scientist Corrado Cali.
Publication
Front. Neurosci., 25 September 2018Science owner
Corrado Cali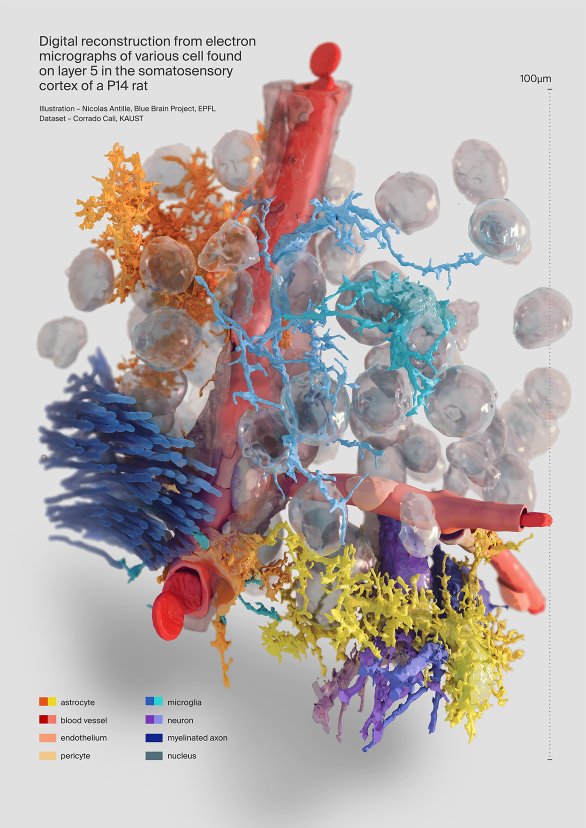
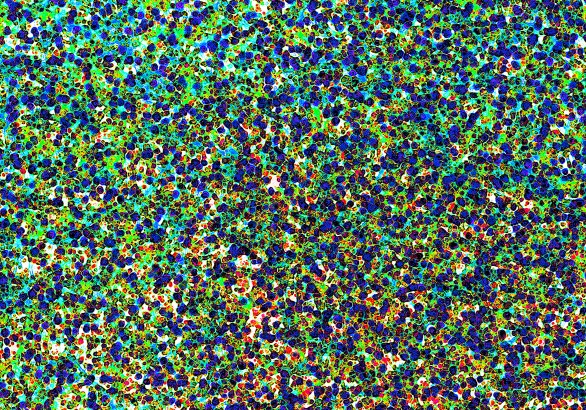
Inside the neocortical microcircuit
Scientific visualization selected by Cell journal to make the cover for a major BBP publication about the microcircuitry of the brain. I also contributed other figures to this publication.
Publications
- Cover of Cell volume 163 issue 2
- Framing [Science] Zürich exhibition 2017
- NZZ article about BBP
- Swiss Chamber of Commerce journals
- PwC CEO July 17
Awards
- Audience Award, best scientific image 2017-2021, SNSF
- Aesthetic Merit, Seeing Life Science, EPFL 2018
Science owner
Eilif Muller et al.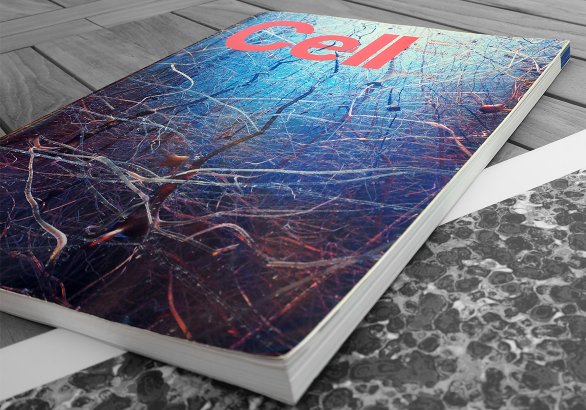
 Framing [Science] SNSF image competition selection, Zürich
Digital 3D reconstruction of capillaries in the neocortex
Using field-based meshing – aka "metaballs" in Blender, I developed a way to automatically reconstruct 3D surfaces for large datasets. This method builds the mesh by blocks so it can build any dataset.
The graph skeleton was calculated by E. Zisis and the raw data was provided by Bruno Weber et al. ETHZ.
Publication
- Front. Neurosci., 25 September 2018
- Le grand Atlas du cerveau (2018). Glénat Livres
Award
2nd place award, professional illustrators categoryAEIMS 18 medical illustration congress
Science owner
Eleftherios Zisis et al.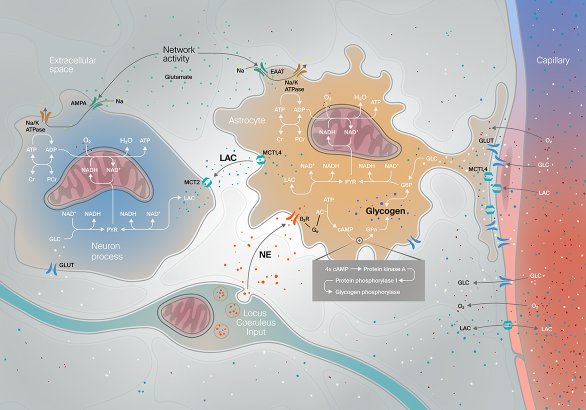
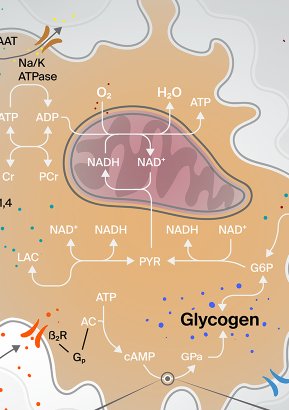
Energy supply between cells in the brain
Illustration about noradrenergic modulation of energy supply in the neuro-glial-vascular ensemble or in less barbarious terms, how molecules flow and interact between blood vessels, astrocytes and neurons.
Publication
Front. Neurosci., 25 September 2018Science owner
Jay Coggan et al.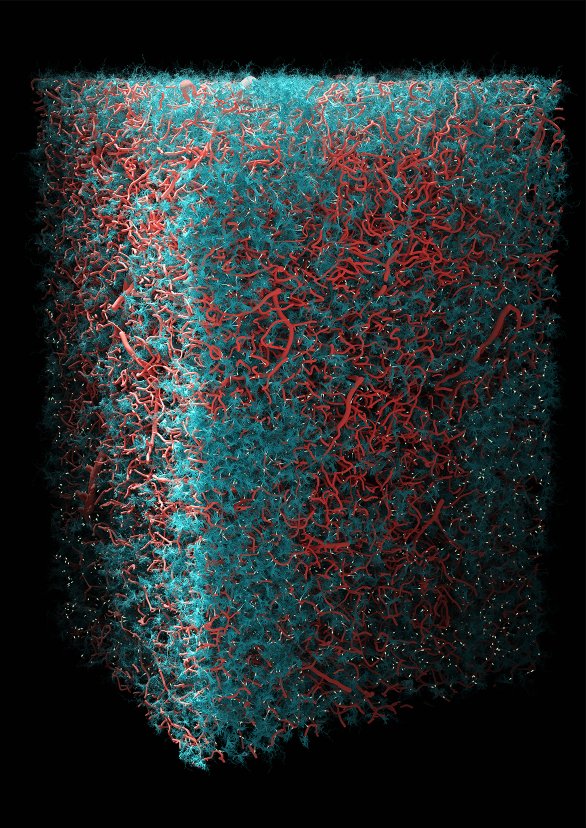
Astrocytes growing perivascular processes
A major step after reconstructing vasculature is to have synthesized astrocytes filling a good part of the volume occupied by blood vessels and neurons. Here neurons are not shown. The astrocytes in blue grow special branches in white that are about to wrap nearby capillaries in red to get nutrients and distribute them to neurons, among many other roles theses cells perform.
Publication
- Scientific poster, SfN 2017
- Le grand Atlas du cerveau, 2018
Science owner
Eleftherios ZisisTechnical note
This large-scale visualization was possible thanks tomy optimization using curve primitives in Cycles raytracer.
This has inspired the BBP visualisation team to use the same technique with other rendering engines like OSPRay.
Meshless objects: 260 million splines
Surface meshes: 12 million polygons

Synaptome of a layer 5 pyramidal neuron
A close-up view of the 4138 local connections – input spines and output boutons – that this neuron forms with other cells (invisible here) in a neocortical circuit. Given points on the surface of the branches and end points, I developed a way to represent spines in a realistic way, based on scientific papers documenting neuron spine types and sizes.
Award
2nd place award, professional illustrators categoryAEIMS 18 medical illustration congress
Tools
Custom Python library for meshing and visualization, Blender, Cycles.Science owner
Eilif Muller et al.The dynamics of the "tree of thought"
Illustration of algebraic topology applied to neuronal simulations at a given state. This is an artistic interpretation of the activity of the human brain from a connectivity standpoint.
Science owner
Kathryn Hess Group
Topology, a mathematical tool for interpreting brain activity
Illustration concept of algebraic topology coupled with neuronal simulation. Using simulation data on the left hand, I revealed the other "multidimensional side" in an orthogonal projection. Black and white here is a visual code I chose for domains that are beyond our sight. When many neurons are connected together at a given time, they form simplices of high dimensional orders and even "cavities", such as the one illustrated here.
This publication generated a small buzz in the scientific community with over 90’000 views in two weeks and a lot of questions asked to BBP.
Publication
Frontiers newsScience owner
Max Nolte et al Volumetric dataset illustrated
From a biological reference
Volumetric data of all sub-regions within the rat hippocampus, with a Nissl staining from an image stack that was the basis for calculating these volumes.
Award
Aesthetic Merit, Seeing Life Science, EPFL 2018.Science owner
Armando Romani Neurons in CA1
To a digital circuit of neurons
A digital circuit of the hippocampus CA1, a collaboration with engineer Cyrille Favreau using the open-source visualiser "Brayns".
Publication
Blue Brain Project's contribution to HBP, a separate entity.Hippocampi and thalami
Distribution of neurons cores in thalami (yellow-orange regions) and hippocampi (blue regions) in the rat brain.
Science owners
Christian O'Reilly and Armando Romani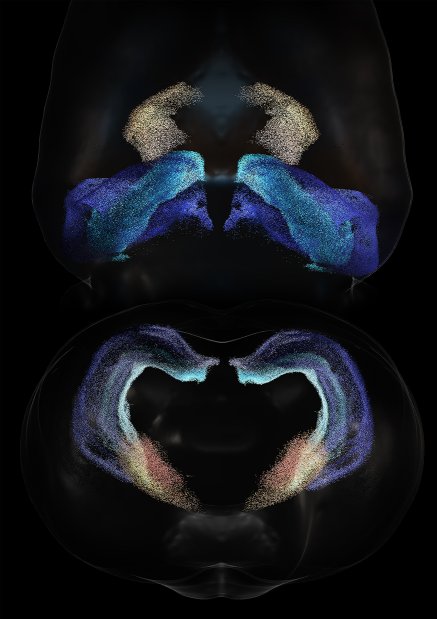
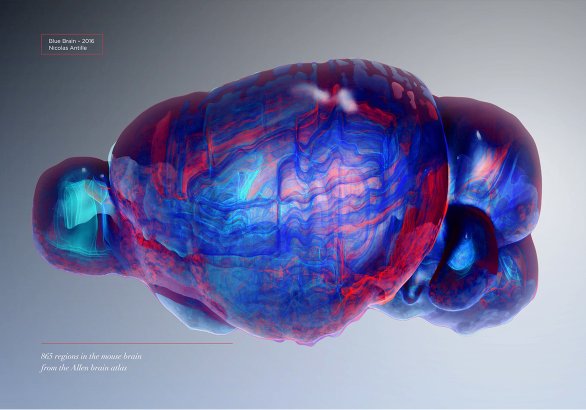
The delicate structure of the mouse brain
Complex datasets are often filtered by sampling/reducing the amount of visible elements. Here I tried to reveal all brain regions at once, with a work on transparency.
Using 3D surface reconstructions of all regions of the mouse brain, this was an attempt to reveal this intricate organ that measures a mere 1.3cm in length.
Science owner
Open source data by Allen Brain Institute Atlas
Layers of neocortical neurons
A frontal view of a thousand neurons in a circuit. They are coloured according to their position within the six layers of the neocortex with an approximate height of 2.2 millimetres.
Publications
- Scientific poster for SfN 2017 and various BBP presentations
- Promotion for a massive open online course
Science owner
Eilif Muller et al.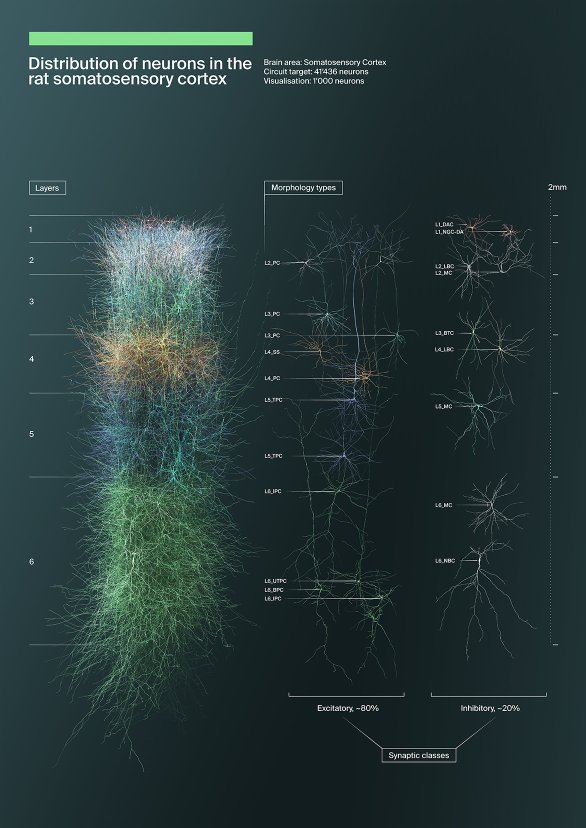
A grant for neuroplasticity
Synapses evolve over time. While connections are formed and strengthened, others dissolve.
This visualization was requested to show research on neuroplasticity which got a grant of 100M core hours offered by ALCF (Argonne, USA) to Blue Brain in order to run simulations to study plasticity in the neocortex.
Science owner
Guiseppe Chindemi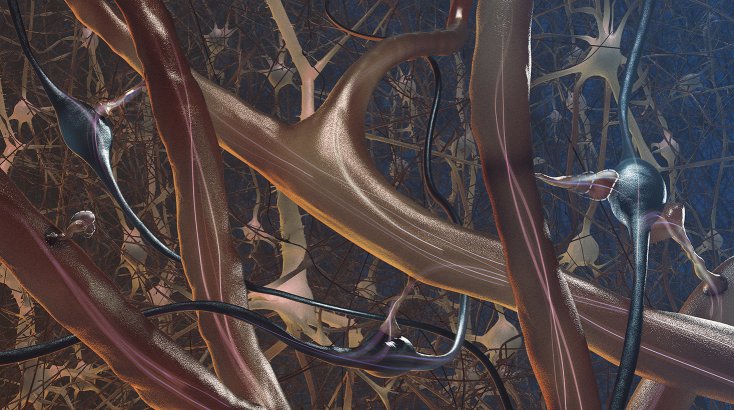
Somatosensory cortex simulation
This is one of the largest simulations of the neocortex that BBP produced in mid 2017. The simulation is 87 Terrabyte large for a mere 217’000 neurons. A collaboration with engineer Cyrille Favreau.
Science owner
Guiseppe Chindemi et al.Cell cores densities
Visualization of neocortical densities of neurons (red), astrocytes (green) and blood vessels (blue). Intricate details appear close-up. The denser layer 4 is clearly visible close to the top of the image.
Publications
- Swisscom article about BBP
- PwC CEO journal, July 17
Science owner
Eleftherios Zisis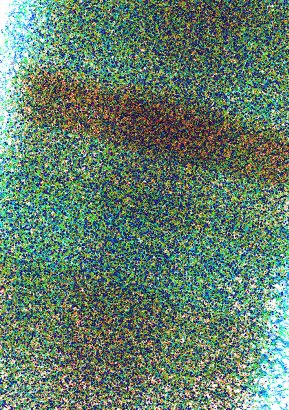
Optomechanics illustrations below done for the Laboratory of Photonics and Quantum Measurements, EPFL.
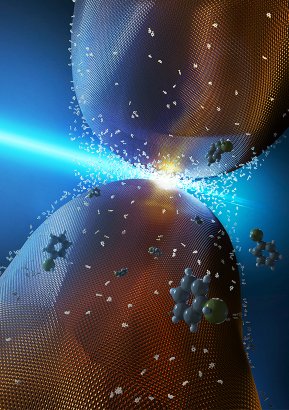 Image published in Nature Nanotechnology
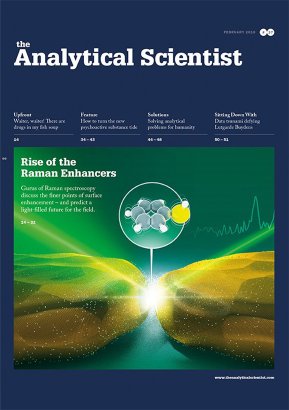 Cover of The Analytical Scientist
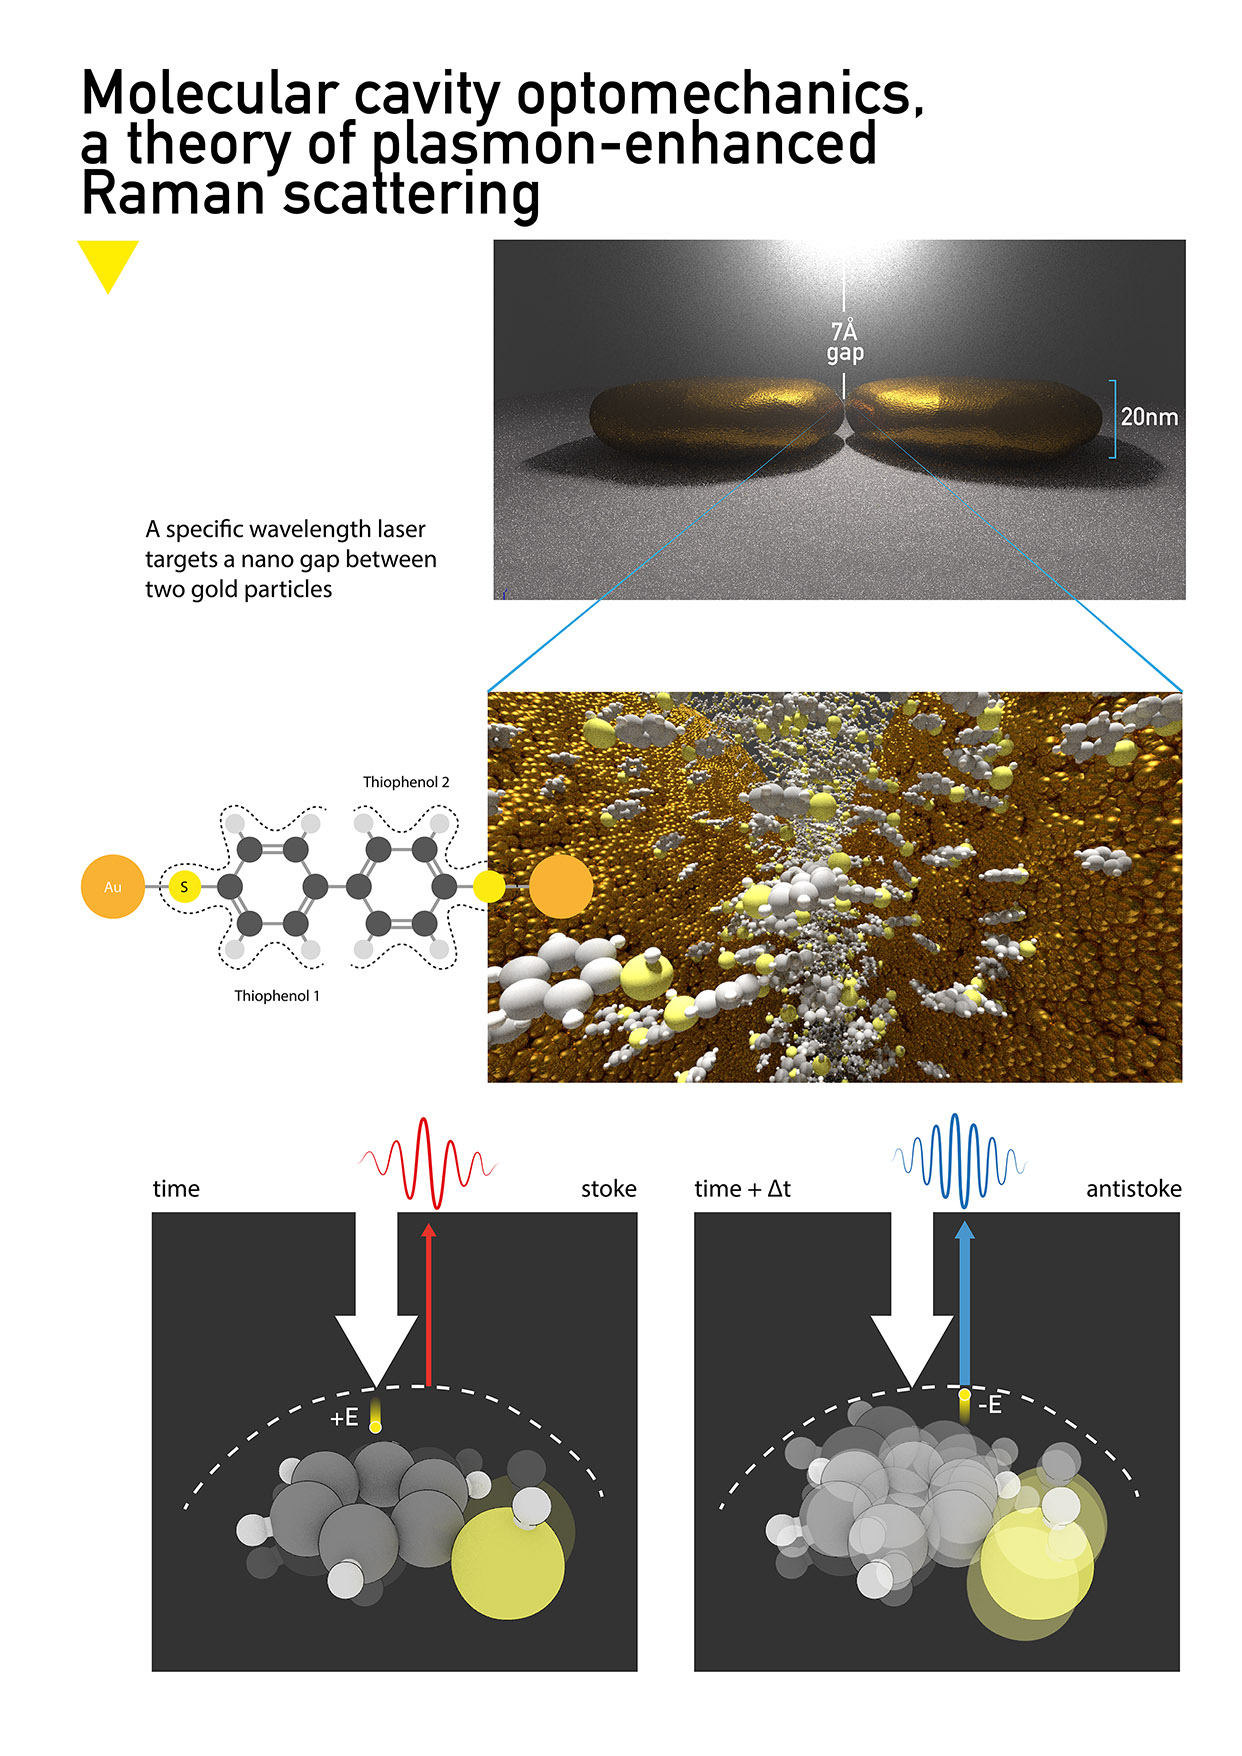 Illustration of the tiophenol reaction to specific wavelength laser within the 7Å gap between gold particles.
Molecular cavity optomechanics
Nano particles of gold are positioned to make a nano gap of about 7Å. When this gap is lit with a precise wavelength, tiophenol molecules react, "store" photons and scatter them soon after [Raman scattering]. Philippe Roelli et al described the inner workings of this phenomenon which resulted in a lot of attention in the scientific community and this will pave the way for new quantum technology.
Publication
- Nature Nanotechnology TOC Volume 11 Issue 2
- The Analytical Scientist #37
Science owner
Tobias Kippenberg, Philippe Roelli et al.Nicolas Antille © 2015-2020
About these scientific illustrations
Vision & work
I strive to make meaningful and aesthetic visualizations for each and every project, in close collaboration with scientists. As an engineer, I read scientific papers, analyze data and I do research and development to create algorithms and tools – often based on open source ones – that process data produced by the hard work of scientists. As an artist, I use such tools to reveal scientific research with novel and insightful visualizations.